News: The 'culprit' of the crash
Grayscale suddenly increased its ETH holdings:
Last night, Grayscale Fund made a large increase in positions, seemingly positive but triggered market panic! The main force is using good news to offload, and retail investors chasing long positions are getting trapped.
The Federal Reserve adopts a hawkish stance:
The early morning meeting minutes hinted at 'possible rate hikes in September', the dollar soared, and the crypto market was in chaos! But note: ETH whale addresses are quietly bottom-fishing, smart money is already moving!
Technical analysis: Key positions are being closely monitored!
Ethereum (ETH) short-term trend analysis and contract strategy
1. Market fundamentals and capital movements
1. Consistency of exchange quotes
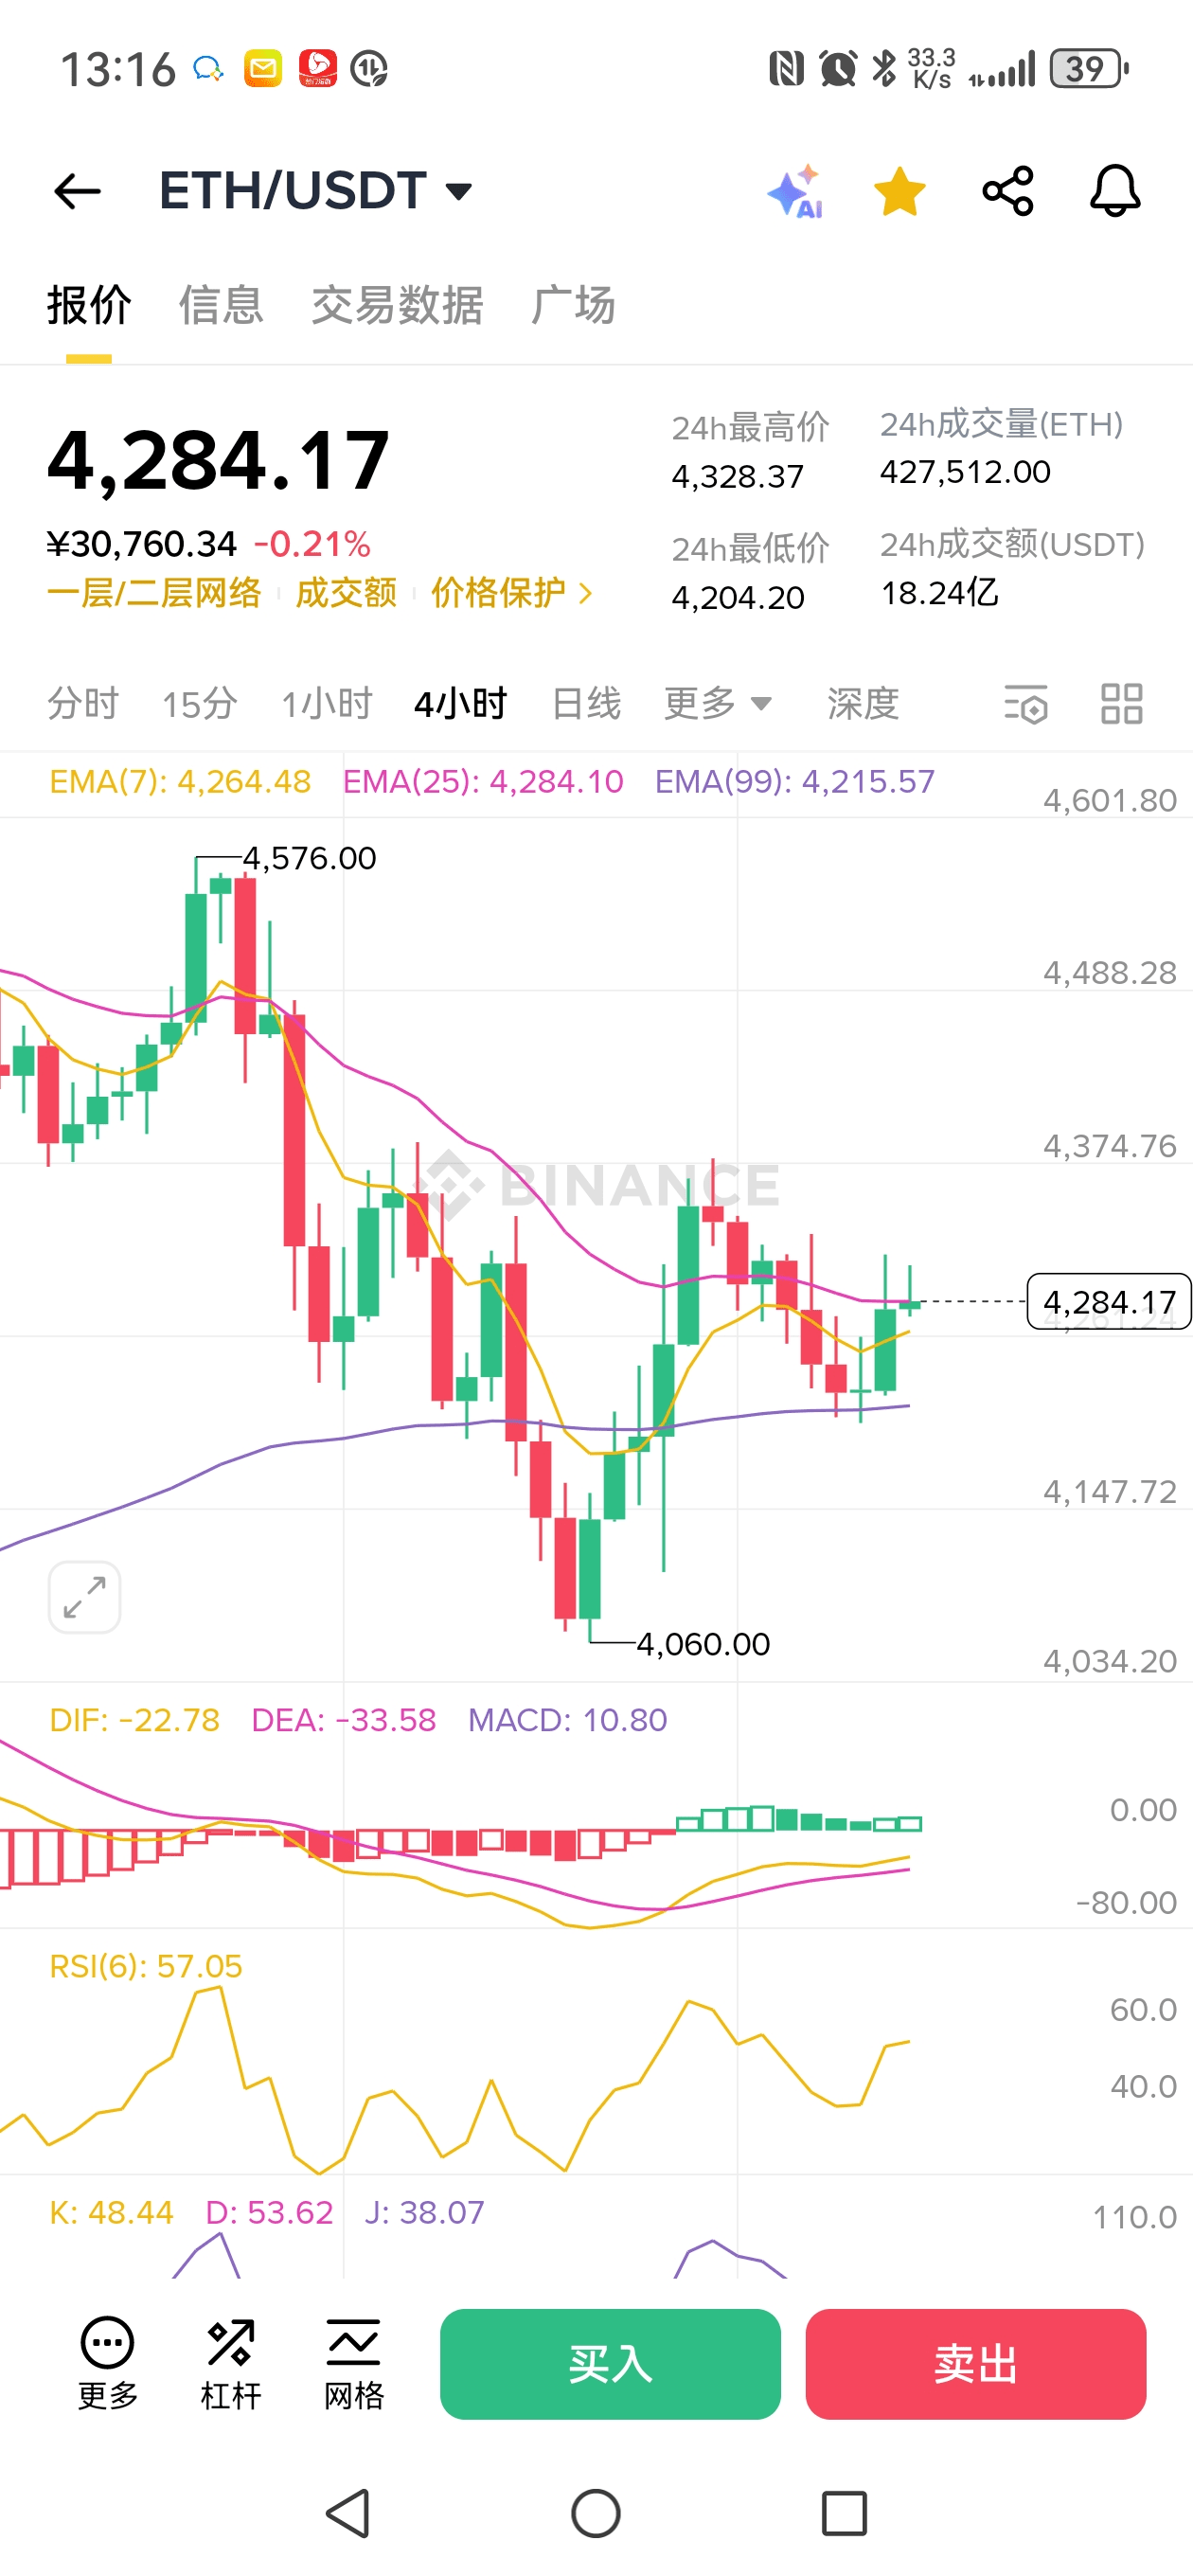
Current ETH/USDT quotations on mainstream exchanges (Binance, Coinbase, Kraken) are in the range of 4280–4300 USDT, with very small price differences, indicating a strong short-term market consensus.
2. Policy dynamics: Long-term benefits are still being digested
Trump signed an executive order allowing cryptocurrencies to be included in the 12.2 trillion USD 401(k) retirement accounts, which may inject a large amount of funds into ETH in the long term, but the policy needs to be reviewed by the U.S. Department of Labor for 180 days, and short-term effects may lag. The market is currently more focused on capital rotation and technical battles.
3. Whale movements: Clear divergence between bulls and bears
Bullish signal: On August 14, a major whale repurchased 10,730 ETH at 4715 USDT, indicating some capital is bullish; on August 18, a whale transferred ETH staked for 1.5 years to exchanges, with a profit exceeding 20 million USD, possibly for profit-taking by long-term holders.
Bearish signal: On August 2, a whale with a '75% win rate in four battles with Ethereum' went short 40,000 ETH at 3535 USDT, currently with a floating profit of about 7.5 million USD, and still holding a 15x leveraged short position, indicating bearish strength is not entirely exited.
4. Contract liquidation: Long stop-loss pressure release
On August 19-20, when ETH fell below 4300 USDT, it triggered over 700 million USD in long liquidations, with bears expanding profits by taking advantage of market panic. The 4300 USDT level remains a psychological barrier for bulls, and if the price rebounds to this range, it may encounter selling.
2. Key technical levels and indicators
Combining the provided 4-hour, 1-hour, and daily chart analysis:
Support levels: 4204 USDT (24h low), 4060 USDT (recent low on the 4-hour chart), 3900 USDT (200-day moving average on the daily level).
Resistance levels: 4328 USDT (24h high), 4488 USDT (previous high on the 4-hour chart), 4788 USDT (recent high on the daily chart).
Coinwings AI indicator signals:
4-hour chart: RSI(6)=56.38 (neutral to strong), MACD green bars narrowing (bearish momentum weakening).
Daily chart: RSI(6)=50.13 (bull-bear balance), MACD dead cross but not diverging (the adjustment trend is not clear).
3. Short-term trend prediction and contract strategy
1. Upward scenario (probability 60%)
- Trigger condition: breaks 4328 USDT and stabilizes, accompanied by increased trading volume (e.g., surge in buy orders on exchanges).
Target levels: first resistance at 4488 USDT (previous high on the 4-hour chart), second resistance at 4788 USDT (recent high on the daily chart).
Short entry timing: If the price rebounds to the 4350–4400 USDT range (near previous high resistance), positions can be lightly shorted, with the stop loss set at 4450 USDT (if it breaks the previous high, the trend reverses).
2. Downward scenario (probability 30%)
Trigger condition: falls below 4204 USDT (24h low), or whales sell large amounts (e.g., ETH moving to exchanges for liquidation).
Target levels: first support at 4060 USDT (recent low on the 4-hour chart), second support at 3900 USDT (200-day moving average on the daily level).
Long entry timing: If the price pulls back to the 4150–4200 USDT range (near key support), positions can be lightly increased, with the stop loss set at 4050 USDT (if it falls below 4060, the support fails).
3. Oscillation scenario (probability 10%)
Range: 4200–4300 USDT, with balanced bullish and bearish forces, suitable for high selling and low buying.
4. Position adjustment principles and risk control
1. Position increase:
When going long, if the price breaks 4250 USDT and confirms support on a pullback, positions can be increased (total position not exceeding 50%).
When going short, if the price falls below 4280 USDT and shows weak rebounds, positions can be increased (total position not exceeding 50%).
2. Position reduction:
When going long, if the price touches the 4300 USDT resistance level and trading volume shrinks, reduce positions by 30%-50%.
When going short, if the price touches the 4200 USDT support level and shows a long lower shadow, reduce positions by 30%-50%.
3. Stop loss and take profit:
Single loss should not exceed 5% of the principal, with a take profit target of at least 1.5 times the stop loss (e.g., if stop loss is 50 USDT, take profit should be at least 75 USDT).
5. Summary
ETH is constrained by resistance at 4300 USDT and support at 4200 USDT, with clear divergence between bulls and bears. If it breaks 4350 USDT, long positions can be pursued up to 4500 USDT; if it falls below 4200 USDT, short positions can be targeted down to 4000 USDT. Strict position control is required, with strategy adjustments based on whale movements and liquidation data.$ETH