$BTC is trading around 113,086.75, down -0.67% on the day, with BTCUSDT Perp hovering near 113,044.5 (-0.68%).
Bitcoin’s chart is whispering two wildly different stories—and tension is mounting. On the hourly chart (Aug 22, 2025), BTC is caught in a bearish rhythm: lower highs, lower lows, and price trapped inside a critical red-highlighted zone.
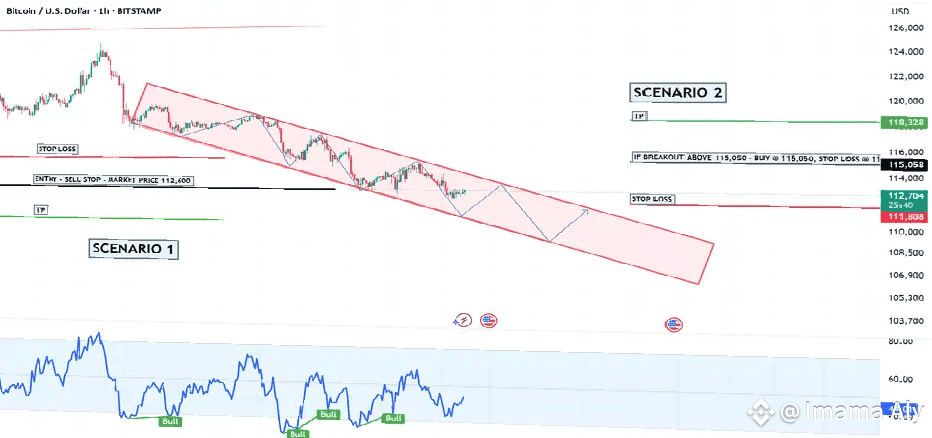
🔍 The Two Scenarios:
1️⃣ Bullish Case → A breakout above the red zone could trigger a resistance retest and fuel a short-lived relief rally.
2️⃣ Bearish Case → A breakdown below the zone may accelerate deeper downside pressure, dragging BTC into another bearish leg.
Right now, the market structure feels heavy, with sellers pressing hard. But history shows BTC thrives on these pivotal forks in the road—where uncertainty often precedes explosive moves.
👉 For traders, this is a textbook “prepare both ways” moment. Keep a close eye on that zone.
If bulls break through, upside momentum may follow.
If bears dominate, brace for sharp dips.
⚡ It’s moments like this that define big moves. Will Bitcoin tear higher—or slink lower?
Your strategy starts now.
#BTC☀ #bitcoin #cryptotrading #PriceAction #Binance

