In brief
The number of owners of 3–6 month Solana options decreased from 14.84% to 12.96%, while the number of owners of 1-day or 1-week options decreased from 7.87% to 4.06%, indicating aggressive behavior in exiting options.
A 'double top' pattern has formed on the daily chart around the $206–$209 mark, and if the $183 mark is breached, Solana may retest the $175 mark and drop to the $161 mark.
SOPR remained below recent local peak values, indicating weak profit realization and waning confidence.
$SOL has almost nullified its three-month gain. The weekly chart shows a decline of 10%, with a drop of 6.2% over the last month, raising doubts about whether the Solana altcoin rally is fading or about to continue weakening.
Despite a history of sharp jumps, recent deviations from the trend and waning holder confidence indicate potential for more serious losses. This is what the latest blockchain data and charts show.
HODL Waves are shrinking, SOPR signals weak conviction
The share of mid-term bond holders #solana with a holding period of 3 to 6 months decreased from 14.84% as of July 21 to 12.96% as of August 20. This indicates that wallet owners who held SOL for a significant part of the recent rally are now actively exiting their positions.
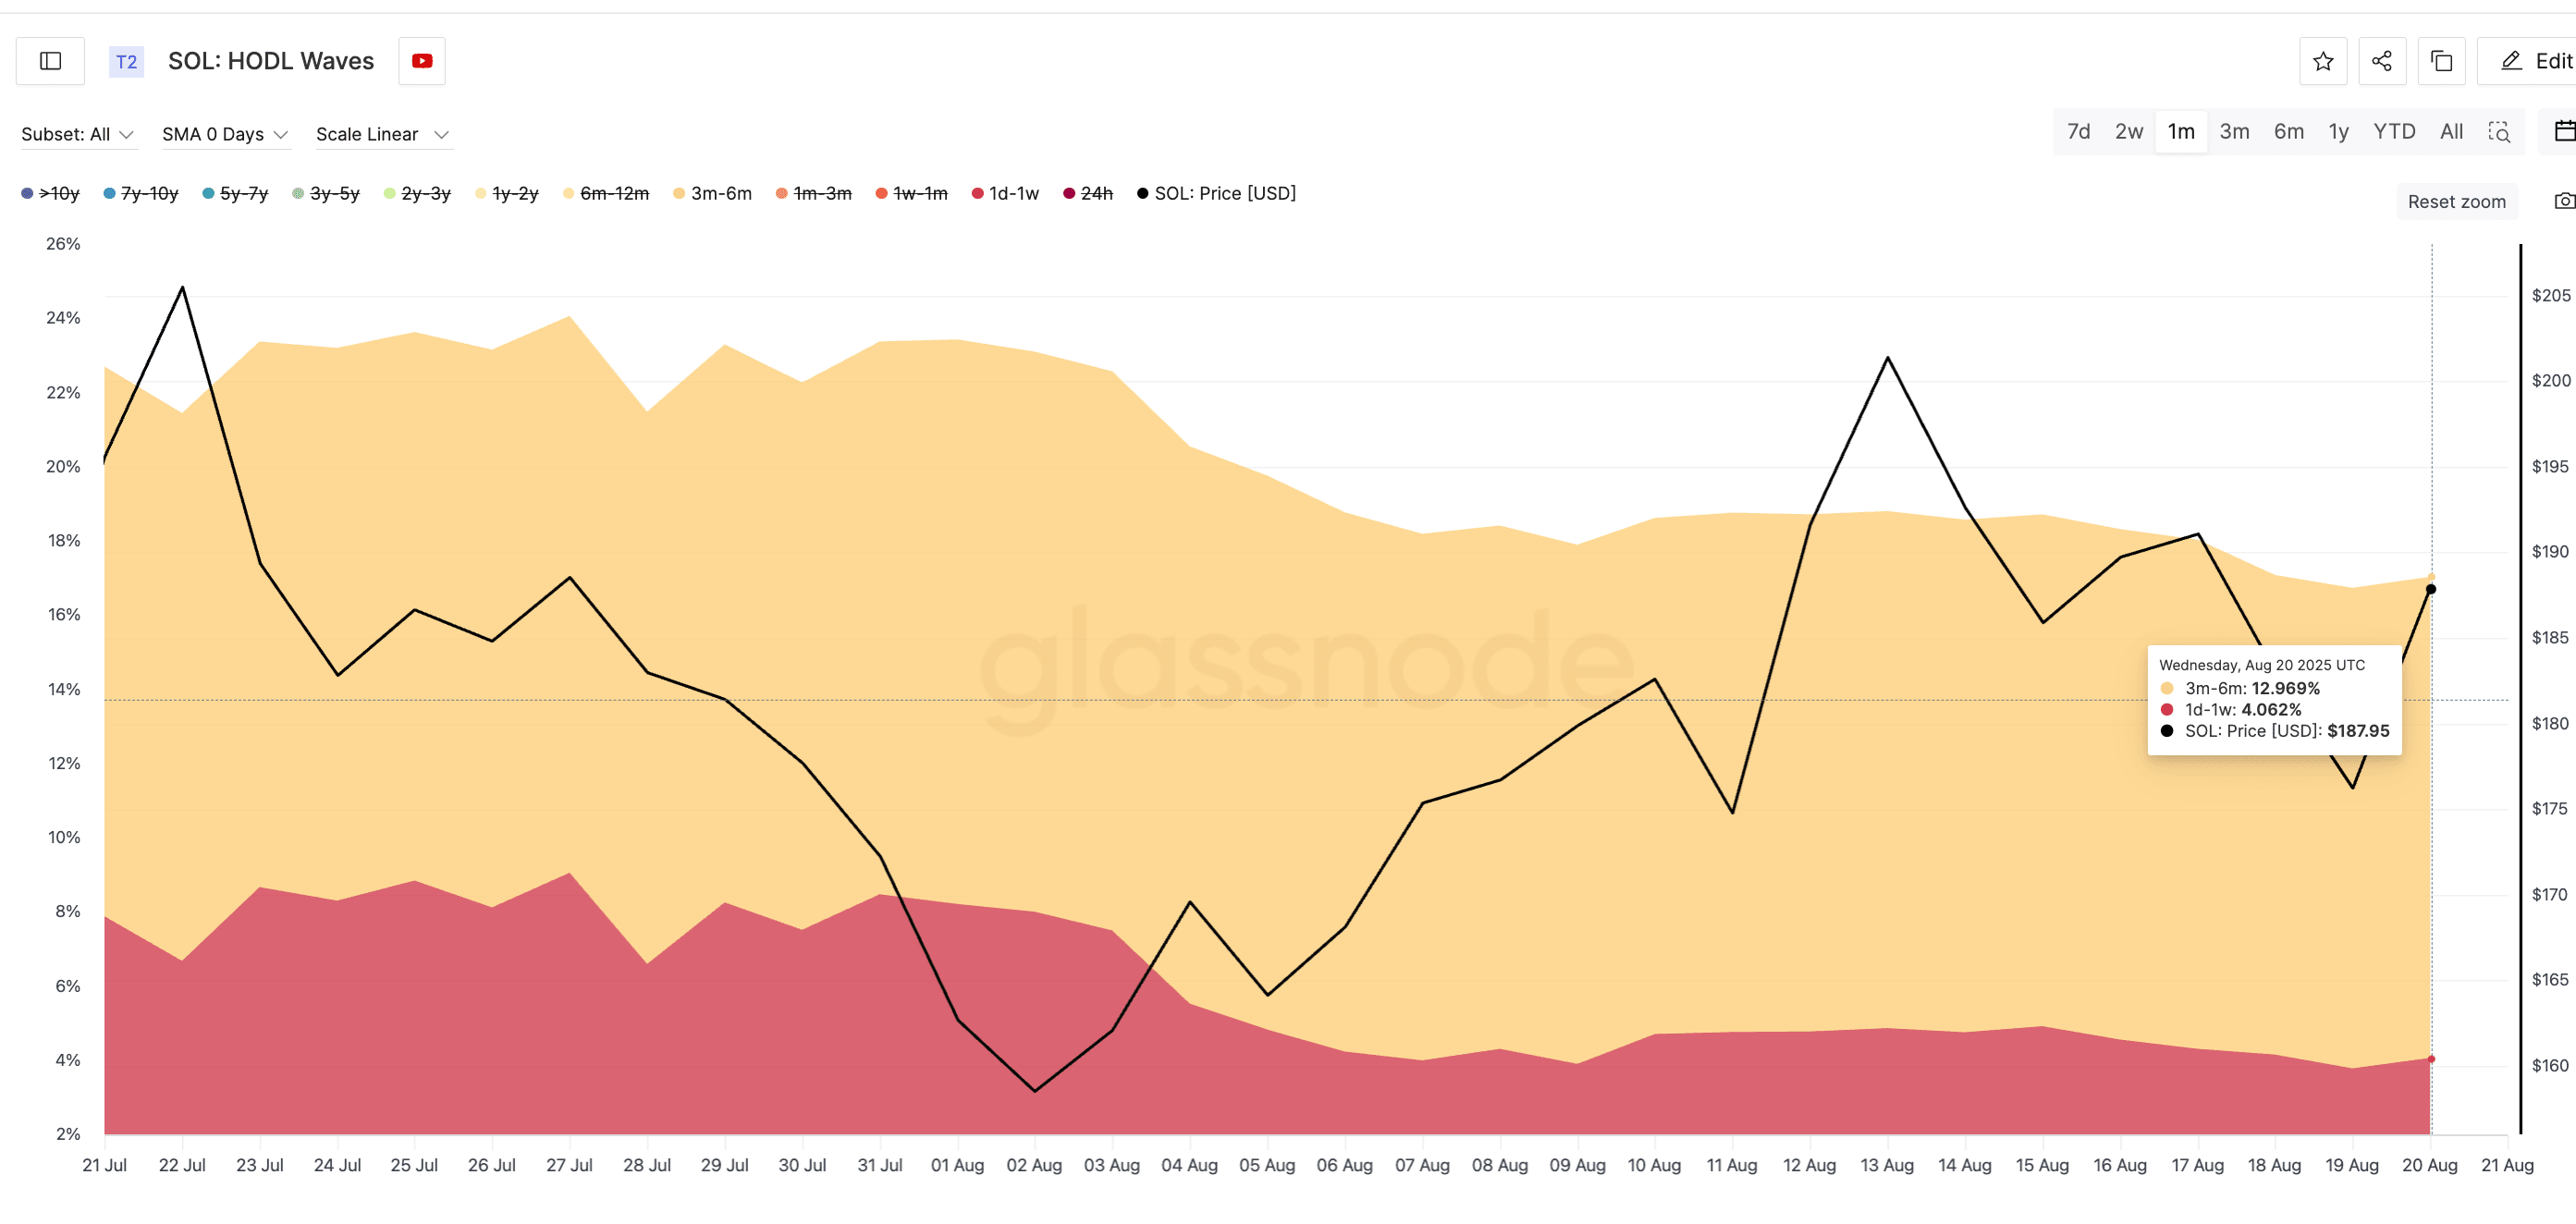
At the same time, the share of short-term holders (from 1 day to 1 week) has also sharply decreased — from 7.87% to just 4.06%. This is almost a 50% drop, indicating that even those who recently invested in bonds are not staying long.
HODL Waves show the distribution of held coins across various timeframes, helping to determine which age groups (e.g., short-term or mid-term holders) are increasing or decreasing their positions.
SOPR confirms this weakness. Although it recently jumped from 0.99 to 1.00, it failed to reach the previous local peak. When Solana's price last reached $201 on August 13, SOPR only dropped to 1.03, which is below the 1.04+ level observed during July's peak.
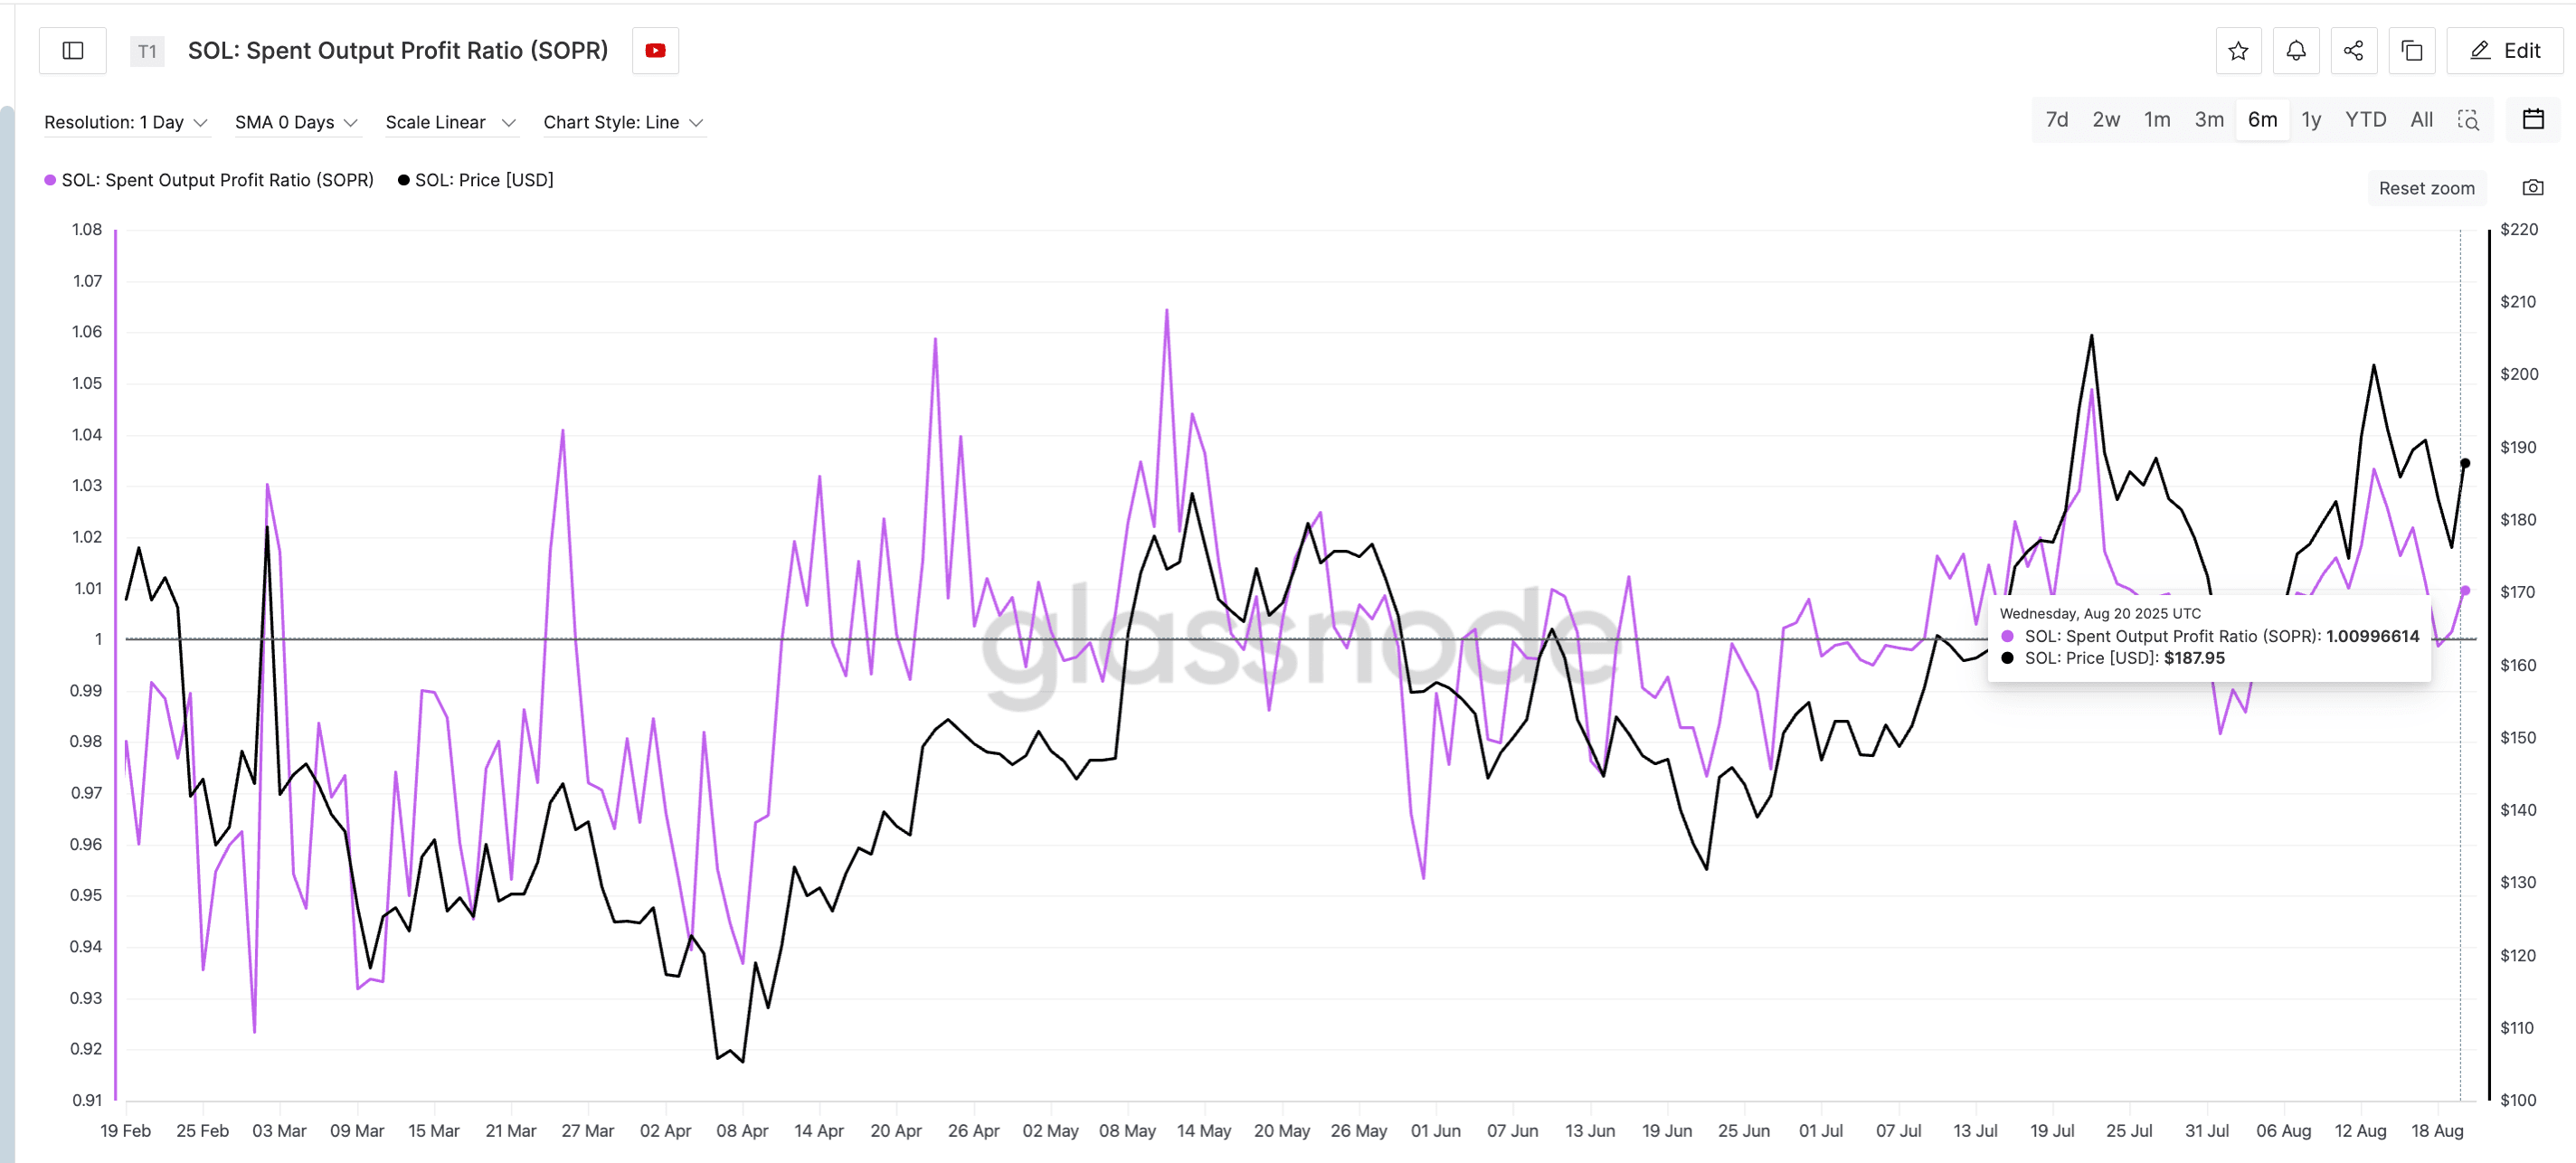
Earlier this year, SOPR reached 1.05–1.06 at even lower prices, indicating that current sellers either exited with lower profits or ceased trading altogether. This shows that confidence is quickly fading; even a slight increase in prices provokes exits.
The Spent Output Profit Ratio (SOPR) tracks whether coins moved on-chain were sold at a profit or loss, where values above 1 indicate profit-taking and below 1 indicate loss realization.
The 'Solana Double Top' price model portends trouble: $161 on the horizon
The price chart of Solana stocks clearly shows a double top. The first peak was $206 on July 21, followed by a slightly higher second peak at $209 on August 14. Despite the higher high, the market decisively rejected both levels — a classic double top pattern.
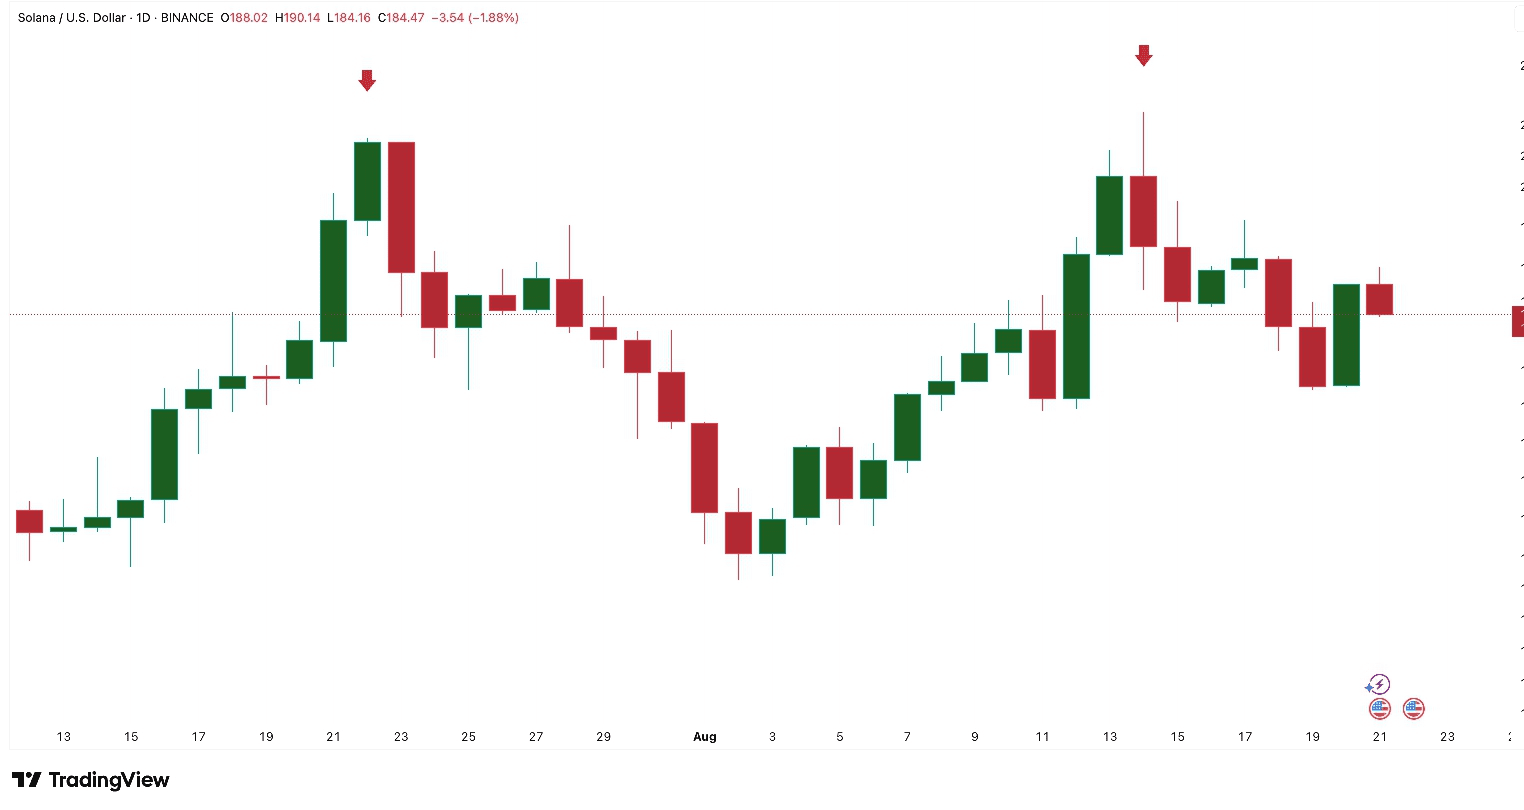
This is a bearish model that often signals further declines.
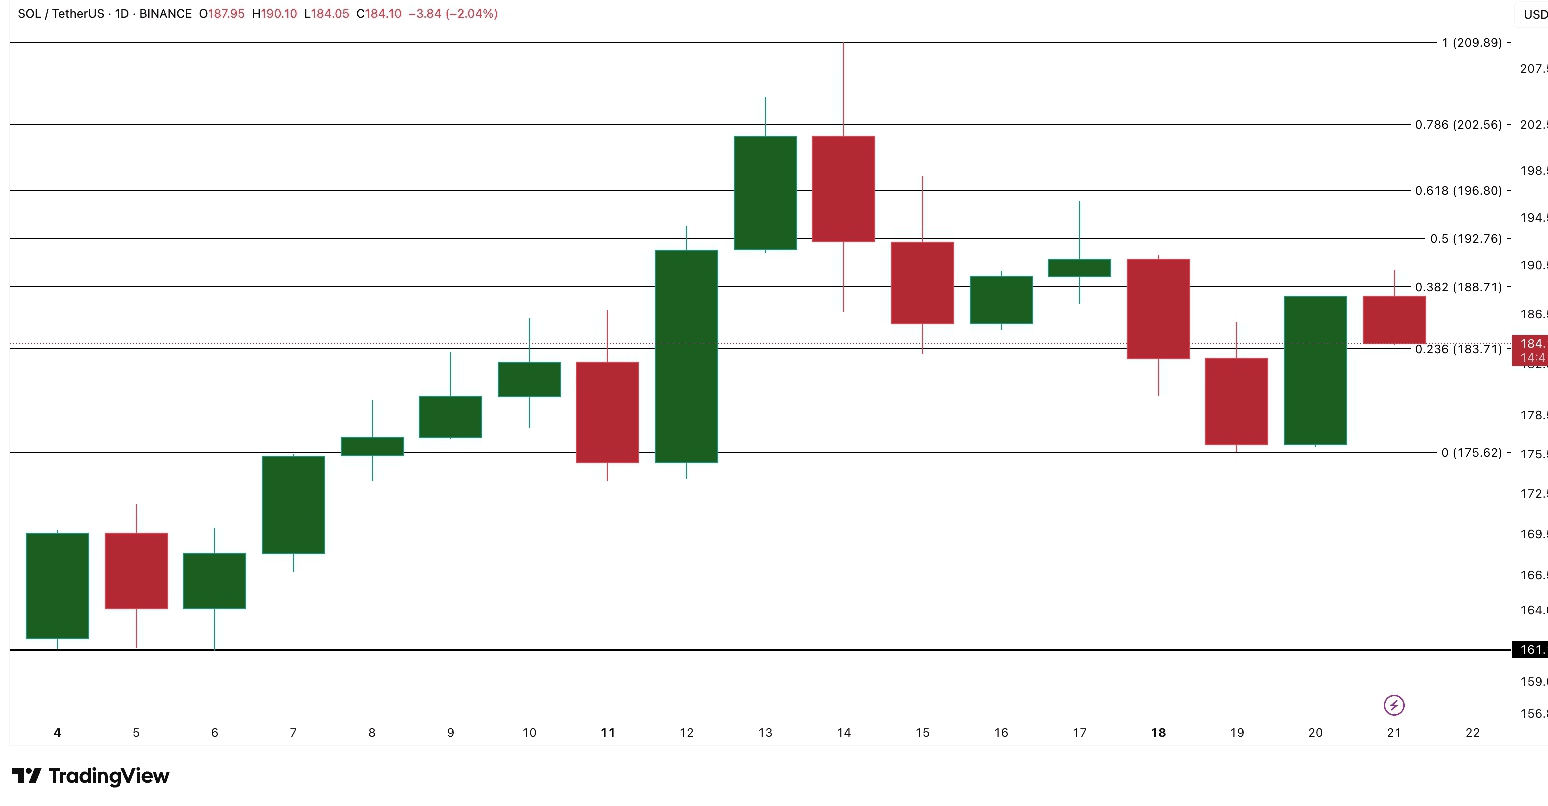
Using Fibonacci correction from the swing high at $209 to the recent low at $175, Solana's price structure shows key levels:
The $183 level remains a key support level. A breach below this level increases the risk of a decline.
If $175 cannot be reached again, the next target for decline will be $161, below which the entire structure will become bearish, and the price of Solana may begin a sharp drop.
To invalidate the bearish setup, $SOL must overcome the $200+ mark with a strong candle close.
At this point, double failures and pressure from both mid-term and short-term holders highlight a downward trend.
#solana #altcoins #Binance #analysis