In the crypto world, one day is like a year, and capital flow is the stethoscope for the market's heartbeat!
Brothers, let's keep an eye on the 1-hour ETH candlestick chart and this eye-catching capital flow chart, and the only two words that come to mind are: anxious! Why do I say that? Let me explain it to you.
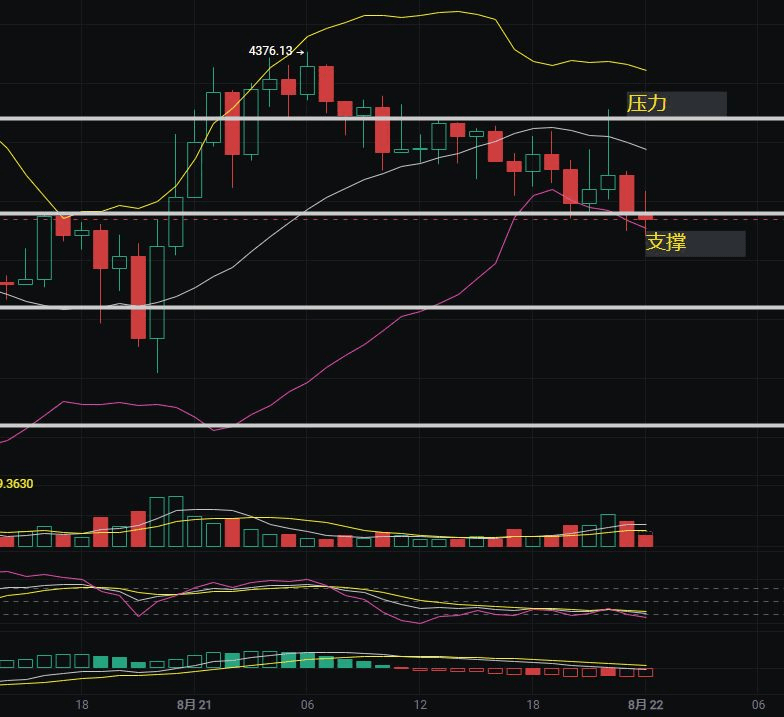
Let's talk about the chart. The price of ETH is like a brother who is exhausted halfway up a slope, going back and forth below the big rock (resistance level) at 4320 USD, and every time he tries to rush, he's been pushed back down. What does this indicate? It shows that the selling pressure above is too heavy, and the bulls (those wanting to buy on the rise) are struggling. Looking at the color of the candlesticks, they are red (or the green bars are shrinking like bean sprouts), and the short-term moving average (yellow line) is about to be pushed down by the medium-term moving average (gray line). This technical signal tells you: the short-term trend is weak, and the buying interest (those wanting to buy) is not very active!
But just looking at the candlesticks is not enough; we need to peel back the layer of capital to see the bones! This latest capital flow chart has so much information that it makes me gasp.
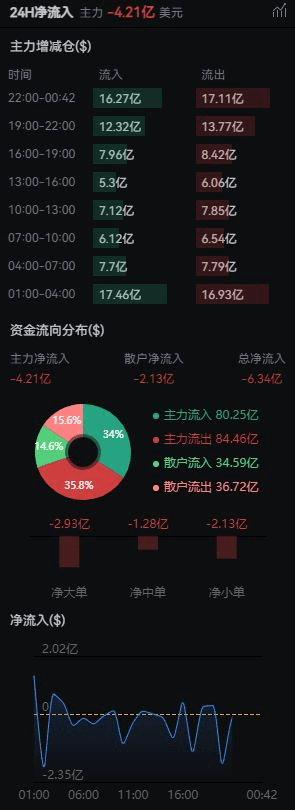
Main players leading a major withdrawal: The most striking is the '24H main player net outflow of 421 million USD'! Several small targets have just flowed out, and this is not a small amount. Who are the main players? They are big funds, smart money! Once they withdraw, market confidence feels like it's been drained. Looking at the time period data, especially from 10 PM to 00:42 at the end of the session, the outflow was 1.711 billion, which was more than the inflow of 1.627 billion! The signs of accelerated outflow at the end of the session are very dangerous.
Retail investors are also running: Not only the main players are running, but retail investors (small funds) have also net flowed out 213 million USD. What does this indicate? It shows that the overall market sentiment is pessimistic, and both large and small funds feel that they cannot stay here temporarily! The total net outflow is -634 million USD, and this blood is gushing out.
The capital distribution chart is more intuitive: That pie chart and the data below clearly show that both main players and retail investors are net flowing out, with more red (outflow) than green. The net large orders (-293 million), net medium orders (-128 million) are all negative, and the entire chart looks unsettling.
My personal opinion:
Combining the 'stagnation' on the candlestick chart and the weakness in technical indicators, along with this capital flow chart depicting the grim situation of 'large funds leading the escape, small funds following, with accelerated outflows at the end', I believe that ETH today and in the short term, the risks far outweigh the opportunities, forming a solid weak pattern!
So, the key question arises: Can the 4235 support level hold?
To be honest, it's precarious! Very precarious! Why?
Capital is the lifeblood of prices: For prices to stabilize or even rebound, there must be real money buying to support it. What about now? The main players are running away, and the capital (funds) is continuously flowing out, with acceleration at the end of the trading session. It's like a battle without logistics and the rear is on fire; how can the position (support level) be defended? Just relying on slogans (market sentiment) cannot withstand the artillery fire from the bears (those wanting to sell on the decline).
Confidence is more precious than gold: The market's confidence is clearly collapsing now, the main players have run away, and retail investors are panicking. In this atmosphere of fear, a slight movement (like a large order hitting the market) could easily break the 4235 level.
Technical aspects combined with capital flow: The price on the candlestick chart is weakly oscillating below the key resistance level, which indicates that the bulls are lacking strength. Although 4235 below was previously a support level, under the pressure of continued large capital outflows, especially the accelerated outflow at the end of the trading session, the strength of this support will be greatly weakened. It's like a dam; if the water (selling pressure) is too great and continues to rise, even the strongest dam may breach.

Unless something happens that can reverse the situation?
Unless a sudden positive development occurs, or some mysterious large capital (like whales) buys heavily against the trend, quickly filling the outflow gap and instantly restoring market confidence. But the probability of such a 'miracle' happening against the backdrop of continuous and accelerated capital outflow is too low. We cannot bet on low-probability events; we must look at reality.
Therefore, I remind all of you, keep an eye on the market today, and the top priority is the 4235 'Maginot Line'! If the capital outflow momentum does not stop (especially looking at the main players' end of session momentum), or if the price effectively breaks below 4235 and cannot recover, it likely means that the downward space has opened up, and the probability of continuing to seek a bottom has greatly increased! Is it a desperate counterattack or a breakdown downward? We need to focus on two points: When will the capital return? Can 4235 hold?
