To be honest, what’s most feared is not the lack of data, but the inability to understand: numerous addresses, numerous transactions, but all clues scattered. What Bubblemaps does is very straightforward - it transforms raw on-chain data into an interactive 'bubble chart', showing who holds a lot of tokens, who is acting together, and who has 'invisible lines' with whom, all visible on one screen. The official defines it as the first supply audit and visualization engine for tokens and NFTs, aiming to turn 'reading the ledger' into 'viewing the map'.
This is not simply 'drawing a pie chart'. Bubblemaps V2 has introduced two 'power tools': Magic Nodes and Time Travel. The former helps you automatically identify key aggregation points or suspicious clusters, while the latter allows you to 'travel through time', reviewing the evolution curves of distribution and migration across different intervals - suitable for dissecting behaviors such as pump and dump, liquidation, and clustering. Binance Academy also lists these two as core functions of the platform and mentions that it has integrated with entry ecosystems like Etherscan, DEXScreener, and CoinGecko.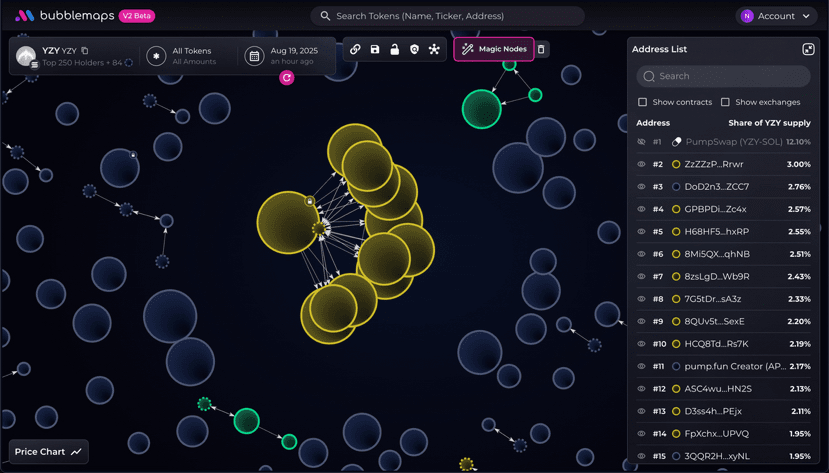
In terms of coverage, Bubblemaps claims to serve multiple public chains (official materials often state 'across nine chains') and will expand visualization services to BNB Chain by 2025, emphasizing tracking wallet clusters, revealing hidden relationships, and monitoring on-chain trends, making the 'cross-chain perspective' more complete.
Why is this useful for trading and risk control? Because often, what you need is not just K-line data, but 'who is behind it'. With group clustering and flow charts, you can more quickly assess concentration risks (whether large holders are overly concentrated), endogenous relationships (whether multiple wallets are acting in unison), and liquidity dead zones (where the pools are and whether they can be exited). This ability to 'turn transparency into readability' is especially critical during meme seasons.
The platform is not just for traders. Bubblemaps positions itself as the 'visualization layer' of InfoFi (Information Finance): providing researchers, funds, and compliance teams with a set of universal tools to 'connect the dots', facilitating auditing, risk control warnings, and project due diligence. The official Wiki states: it transforms the process of 'raw data → structured insights' into a one-click operation.
What’s more interesting is its community investigation layer - Intel Desk. This is not a 'comment section', but a marketization of on-chain investigation: users stake $BMT on cases they care about, and the platform allocates investigation time weekly based on BMT weight - for example, if a case receives 60% of BMT, it gets 60% of the investigation hours; the priority is decided by the community 'voting with their feet', rather than chasing trends.
Bubblemaps' official blog also emphasizes: V2 is free for the public, but holding BMT can unlock more advanced features; Intel Desk is linked with$BMT to form a closed loop of 'case - voting - allocation - output', making intelligence production and distribution closer to real demand.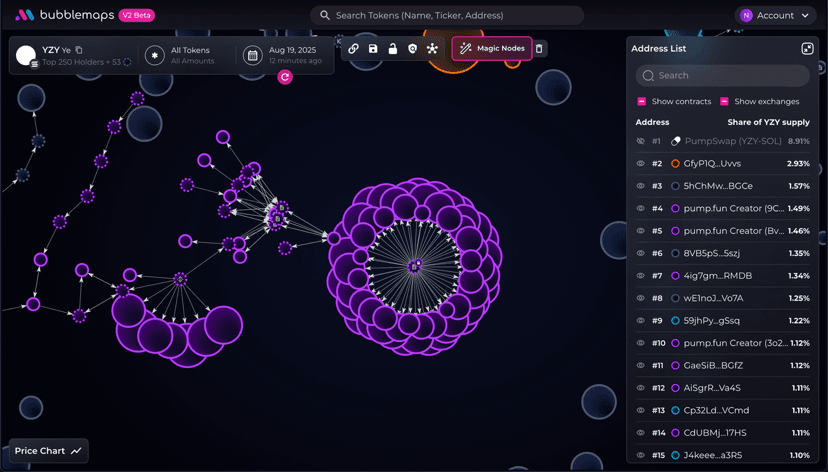
From an 'engineering perspective', Bubblemaps' value lies in visualizing complex causal relationships with low barriers: your brain doesn’t need to remember a hundred addresses and timestamps at once, you just need to see 'which bubbles are always clustered together, and who enters and exits at key points'. For crypto beginners, this is 'just read the chart'; for veterans, this is 'quick screening and warning'.
Of course, the graph is just a clue, not a verdict. Any insights based on visualization need to return to transaction details and contract interactions for secondary validation. The good news is that Bubblemaps' integration at the entry level (browser/market station) reduces friction of 'jumping between ten websites', making 'viewing charts - clicking in - verifying' smoother.
If we compare blockchain to a city, then Bubblemaps is like being equipped with 'traffic radar': who is merging on the main road, who is visiting in alleys, who suddenly has a longer convoy, all clear at a glance. What you need may not be 'more complex data', but clearer clues.
@Bubblemaps.io #Bubblemaps $BMT