Jupiter ($JUP ) is a major player in the Solana ecosystem, but its price has been on a downward trend after failing to sustain its late-July rally. Let's analyze the daily chart to understand the current technical outlook and what to expect next for this token.
Technical Breakdown of the JUP/USDT Chart
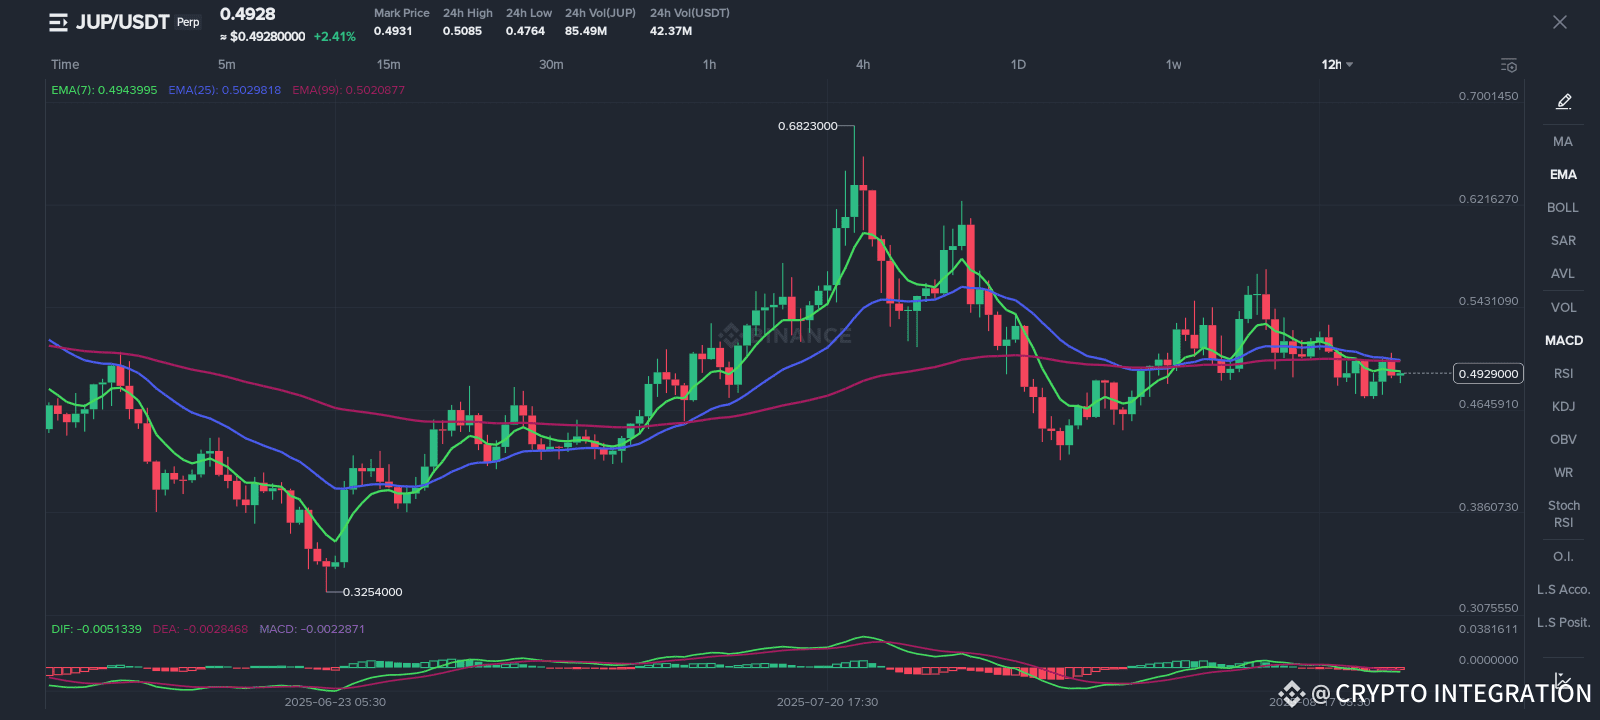
Price Action & Key Levels: After a significant rally that took $JUP to a high of $0.66, the token has been in a corrective phase. The chart shows that the price is currently consolidating in a tight range. It is testing a critical support level around the $0.49-$0.50 zone, a key psychological level that could determine its next move.
Moving Averages: The 20-day EMA (green line) has recently crossed below the 50-day EMA (red line), which is a bearish signal. The price is currently trading below both of these EMAs, confirming the short-term downtrend. These moving averages are now acting as key resistance levels. A decisive move above them would be needed to signal a potential reversal.
MACD and RSI: The MACD indicator is in bearish territory, with the MACD line below the signal line. This indicates that the momentum is currently in favor of the sellers. The RSI is also trending lower but has not yet reached the oversold zone, suggesting there could be more room for a decline if the current support is breached.
Potential Scenarios for Jupiter
The current chart for Jupiter shows that the token is at a critical juncture. If it can hold the support around the $0.49 level, we could see a bounce back towards the EMA resistance levels. However, if this support fails to hold, JUP could face a deeper correction, potentially retesting its previous low around $0.32. The overall performance of the Solana ecosystem and new developments on the Jupiter platform will be crucial factors to watch.
This is not financial advice. DYOR (Do Your Own Research).
Don't miss out on real-time market insights, follow @CRYPTO INTEGRATION