XRP price shows bearish signs below the resistance level of $3.00. The price struggles to break through the levels of $2.950 and $3.00.
XRP price is breaking below the levels of $3.00 and $2.950.
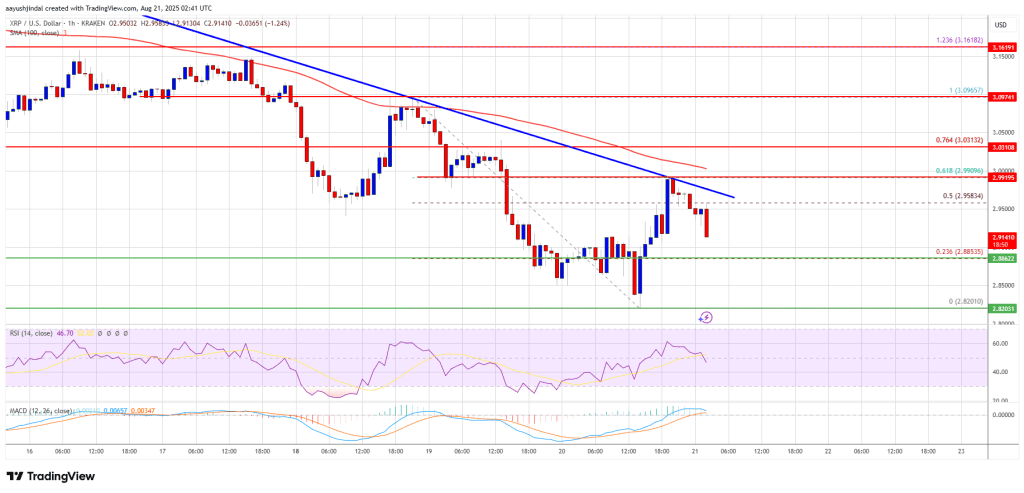
The current price is below $2,950 and the 100-hour simple moving average.
A bearish trendline has formed on the hourly chart for XRP/USD, with resistance at $2.9650 (data sourced from Kraken).
If the currency pair remains below $3.00, it may continue to decline.
XRP price recovery faces obstacles.
After closing below $3.050, XRP price remains in the bearish zone, similar to Bitcoin and Ethereum. The price continues to decline and has fallen below the support area of $3.00.
The price even fell below $2.90. Ultimately, it tested the support area at $2.820. The price formed a low at $2.820 and recently retraced part of the decline. The price once broke above the $2.90 level. The price broke the 50% Fibonacci retracement level of the downward trend from the swing high of $3.095 to the low of $2.820.
However, the bears remain active below $3.00 and below the 61.8% Fibonacci retracement level of the downward trend from the swing high of $3.095 to the low of $2.820. A bearish trendline has also formed on the hourly chart for XRP/USD, with resistance at $2.9650.
The current price is below $2.950 and the 100-hour simple moving average. On the upside, the price may face resistance near $2.950. The first major resistance level is around $2.9650.
 If there is a clear breakout above the resistance level of $2.9650, it may push the price towards the resistance level of $3.00. If it rises further, it may push the price towards the resistance level of $3.050. The next major resistance level for the bulls may be around $3.120.
Another decline?
If XRP fails to break the resistance level of $2.9650, it may initiate a new round of declines. On the downside, the initial support level is near $2.90. The next major support level is around $2.850.
If a downward breakout occurs and closes below $2.850, the price may continue to fall to the support level of $2.820. The next major support level is around $2.780, and if this area is broken, the price may continue to decline.
Technical indicators.
Hourly MACD - The MACD for XRP/USD is currently accelerating in the bearish zone.
Hourly RSI (Relative Strength Index) - The RSI for XRP/USD is now below the 50 level.
Major support levels - $2.90 and $2.850.
Major resistance levels - $2.9650 and $3.00.

