$MEME The #MEME token rose by 37.53% to $0.002903, with exceptional trading activity shown through a 2.01 ratio of trading volume to market cap (331.2 million / 164.4 million). The token is currently testing key resistance levels and remains significantly below the October 2023 ATH of $0.081575, but has strongly rebounded from its recent low of $0.001257.
Current circulating supply: 56.79 billion out of 69 billion tokens
Market Position: Breaking through critical technical levels
Trading Characteristics: High volatility with strong momentum signals
Fundamental Drivers. The destructive Layer X event on August 19 reignited interest in meme tokens, creating a favorable macro environment for MEME token growth. Technical indicators support this bullish trend with positive momentum.
Technical Signals: The MACD indicator shows bullish divergence, and the RSI is above 60
Capital Dynamics: A long-short ratio of 14.68 indicates strong buying pressure
Regional Strength: European markets lead with a price range increase of +0.00078
Trading Forecast for Token $MEME
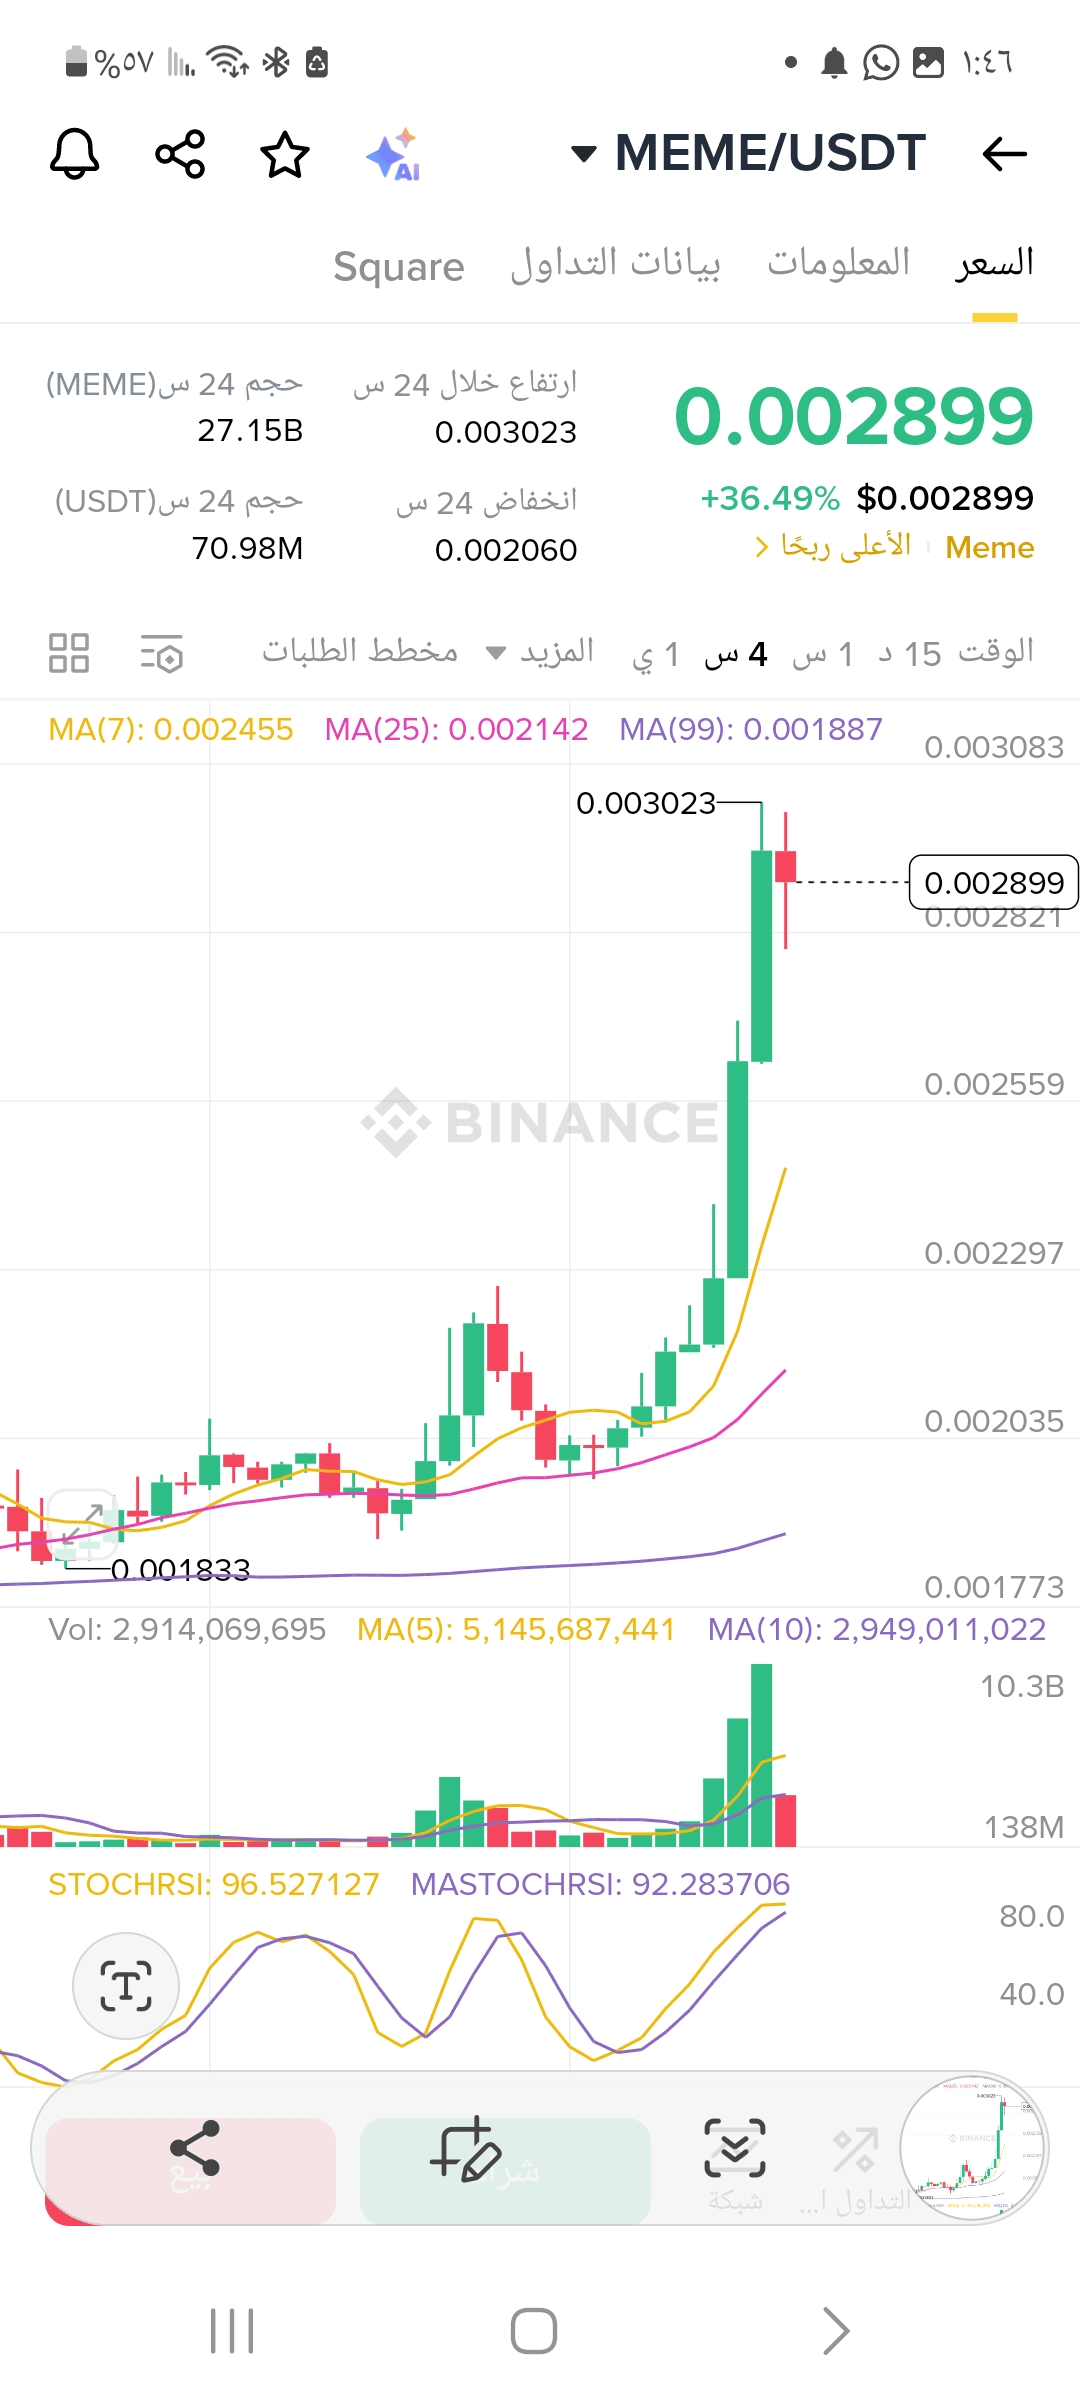 Breaking through the resistance zone of $0.00270-$0.00300 while reclaiming its 100-day moving average—both are significant technical achievements indicating further upside potential.
Target Areas: Fractal patterns suggest the price may rise to $0.0038-$0.0050
Risk Factors: The total liquidation value recently reached $389,000, highlighting volatility concerns
Key Levels: Continuous closes above $0.00300 may lead to further upside, while drops below $0.00250 may indicate potential correction
Community Sentiment The #BinanceSquare platform shows an overwhelming bullish sentiment with 626 positive posts compared to 64 negative posts (90.7% positive). The prevailing narrative focuses on the potential technical breakout and the token's daily performance of 44.21%, despite some warnings about resistance at $0.00270 and potential selling pressure#Binance #EarnFreeCrypto2024 $MEME