Write by .. Crypto _by_Zeehan
Bitcoin (BTC): Bullish Rally or Cautionary Signal?
All-Time High & Institutional Tailwinds
Bitcoin made a new ATH (All-Time High) of $124,002 on August 14, buoyed by potential rate cuts from the Federal Reserve, institutional adoption, and the Trump administration's cryptocurrency-friendly policies.
Profit-Taking and Market Volatility
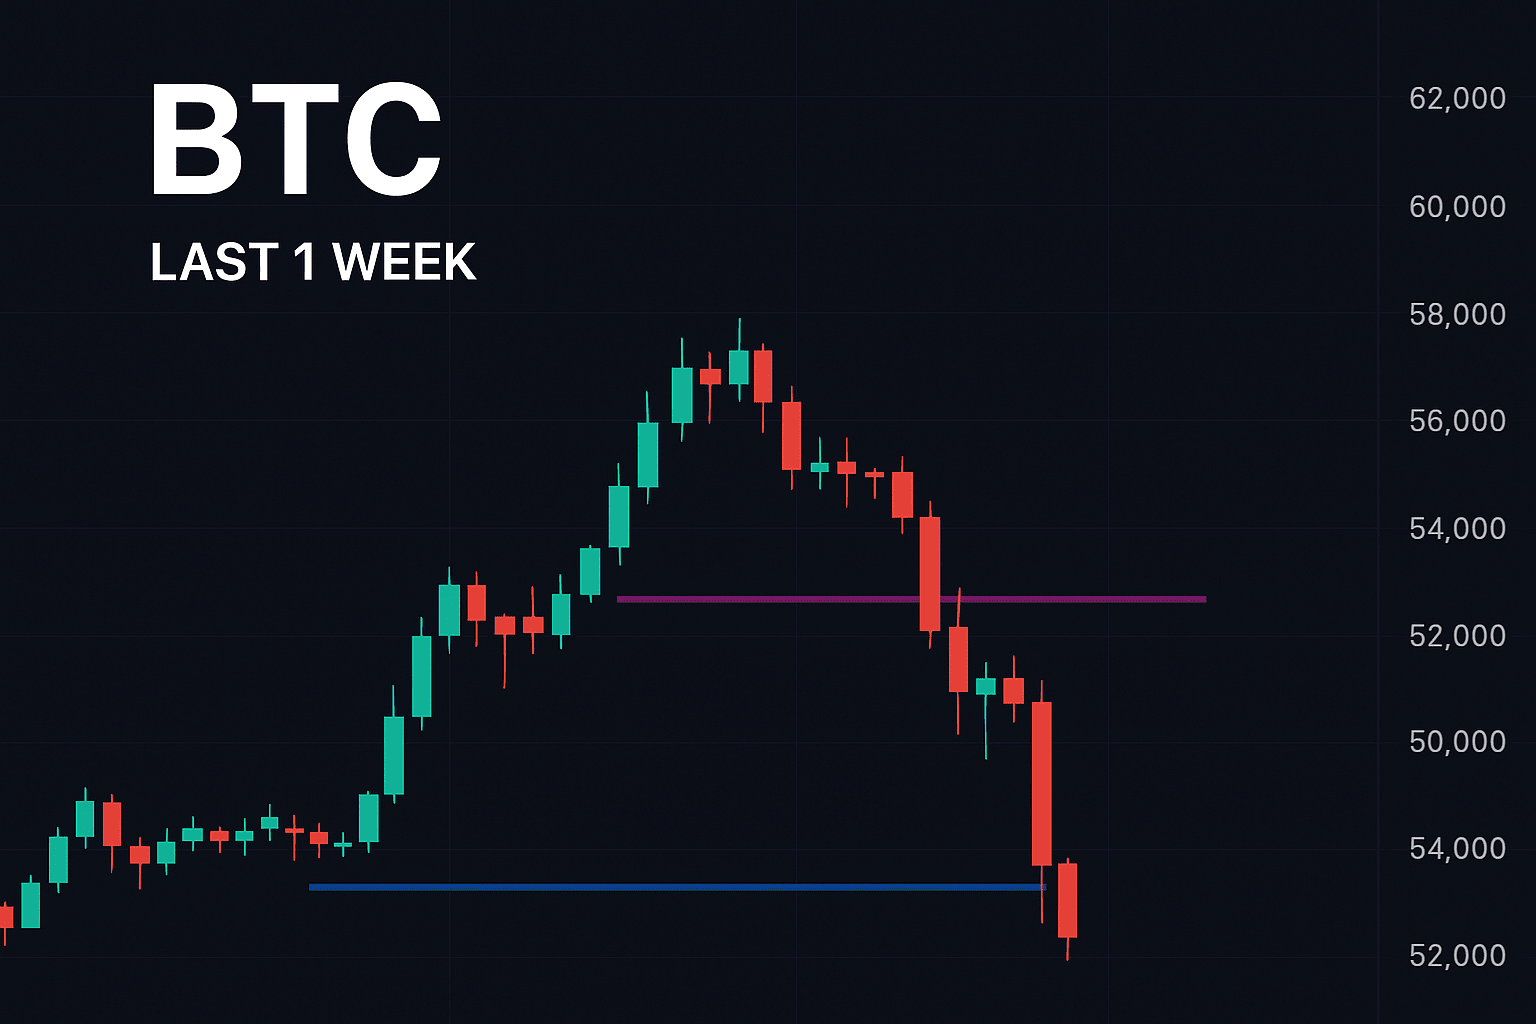
Afterwards, BTC saw a decline, dropping 2.3% in a day to $119,186, primarily driven by investor profit-taking, liquidation of leveraged positions, and uncertainty in U.S. policy signals.
Strong Rally Continues – Retirement Inflows
In August, BTC saw a 3% gain again, primarily due to Trump's executive order and initiatives by major institutions like BlackRock to include crypto in retirement funds.
Of the recent inflows, $572 million net crypto inflow saw $260 million going into Bitcoin alone.
Market Tension and Waiting for the Fed
Weakness has been observed in both crypto and tech stocks, as signals from the Fed's policy minutes are still awaited. This could be a concern, especially regarding the prospects of interest rate cuts.
Learn what was the macro-security related aspect?
Strong support is coming from the institutional side of crypto—like spot ETFs, BlackRock's strong BTC holdings, stablecoin legislation—which could further propel the current bull market.
In brief, an update for BTC:
The August rally has shown strong momentum, breaking traditional seasonal weakness (historical summer slump).
But the Fed's signals and the macro environment will play a crucial role in determining the direction of price.
---
XRP: Stalled at $3 Amid Regulatory Clarity
Regulatory Overhang Ends – But Momentum Slows
XRP is stuck around $3, where recent developments related to ETF approval delays and the Ripple vs SEC litigation (including the lawsuit officially wrap-up) have limited price action.
Technical Consolidation & Downside Risk
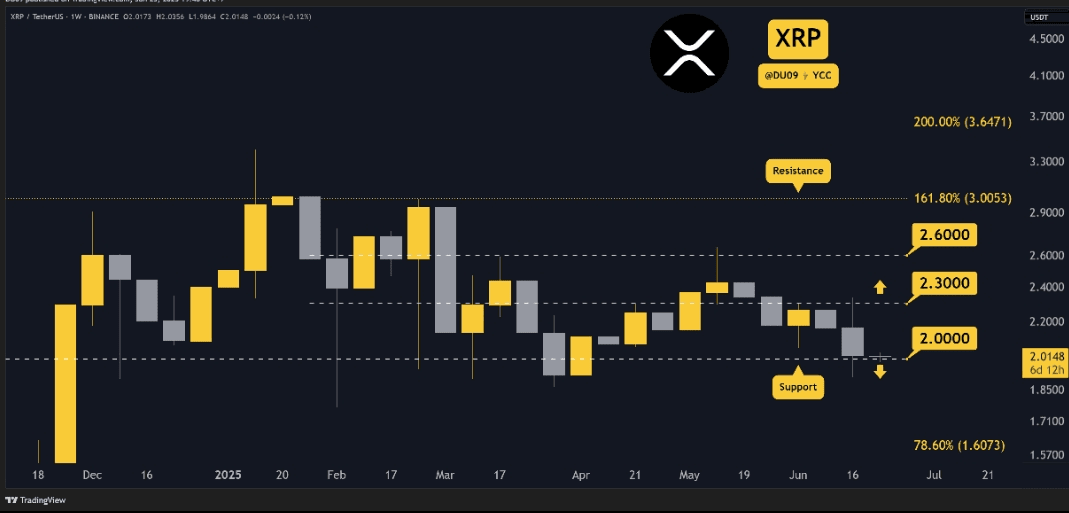
Price is hovering in the narrow zone of 2.94–3.01, and if bulls cannot hold above the $3 area, there is a possibility that XRP could slip further down, e.g., towards $2.24.
Healthy Correction – Bounce-back Potential
Some time ago, XRP saw a decline of up to 19% from its eight-year highs—but analysts consider this a healthy correction, which could lay the groundwork for a new rebound.
Future Upside Possibilities?
While currently stuck at $3, the regulatory clarity (lawsuit wrap-up) and renewed confidence in the market could lead to positive momentum in the future.
Some analysts consider it a generational bottom, indicating the possibility of a big rebound.
General position of XRP:
Currently in consolidation and stabilization.
Attention will be on regulatory developments (like ETF approvals) and technical breakouts.
Today's Snapshot & Outlook
Crypto Major Trends / Updates What could happen next?
Bitcoin (BTC) $124K ATH, drop the next day, then rally again Fed policy signals clarity, maintaining institutional inflows
XRP ~consolidation at ~$3, lawsuit ended, need to see ETF status, breakout or further consolidation
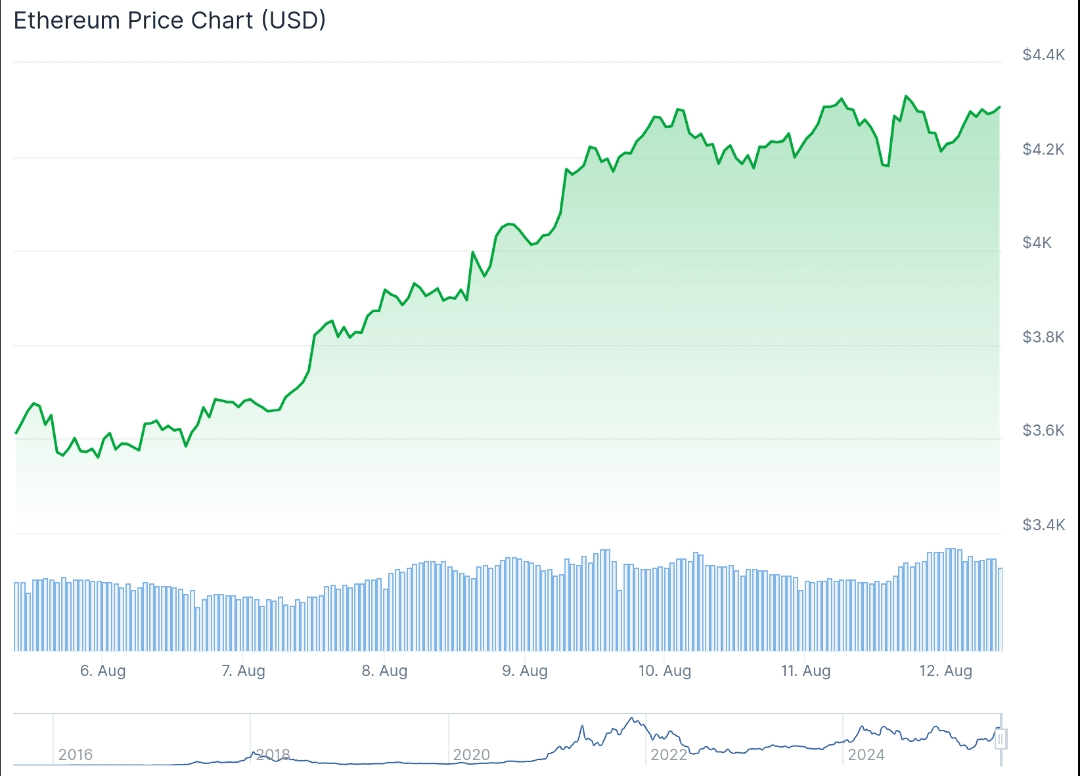
Key points from the chart
The chart shows that Ethereum saw a strong gain last week, trading around ~$4,275—similar to the run-up in 2025.
Institutional inflows (ETFs, etc.) have further accelerated this rally—with significant investments from several large institutions.
---
Technical and Market Update (Current Situation: August 20, 2025)
Weekly Close: ETH recorded the highest weekly close in the last 4 years—around $4,475. This is a significant bullish signal.
Support Zone: The area of $4,000 – $4,150 now exists as a strong support area.
Current Situation:
ETH slipped below this support zone a while ago, increasing the likelihood of price falling below the next level of $4,000.
Around $4,100, this area has switched from previous resistance to support; if that breaks as well, further decline is possible.
---
In brief: What position is Ethereum in now?
Component Details
Last week's rally saw ETH surge with the help of institutional inflows and ETFs, closing higher.
Defending the support zone $4,000 – $4,150 is no longer easy; this area has also been tested on the chart.
If support breaks, levels below like $3,900–$4,000 could become a possibility.
Potential Bounce Point If support holds, a strong rebound towards $5,000 could occur.
