

Gold experienced a robust rally over 12 months starting in April 2024, reaching a peak in April 2025.
Given ongoing geopolitical tensions and policy uncertainties, a bullish outlook for gold in 2026 and 2027 seems well justified.
Currently, gold is in a consolidation phase following this breakout. While this pause may last several months or quarters, the long-term technical structure points to a continued bullish trend.
The principal drivers for sustained strength in gold include continued monetary base expansion, rising inflation expectations, supportive EUR/USD trends, and favorable futures market positioning.
Uptrend gold investment background, Digital illustration of gold bars with an overlaying stock market graph representing wealth and investment strategies.
Gold experienced a robust rally over 12 months starting in April 2024, reaching a peak in April 2025 amid heightened market concerns during the so-called "Trump Tariff Turmoil." The key question now is whether this upward momentum will persist—will the gold price forecast for 2026 be bullish, bearish, or neutral?
Understanding the Drivers Behind Gold
It’s important to consider who has been driving gold demand. For most of 2024, buying was led primarily by non-Western investors and central banks. This is significant because if Western investors, who largely missed the 2024 rally, decide to enter the market amid rising uncertainty, they could trigger a new phase of buying—potentially fueled by a “fear of missing out again” (FOMOA) on future gains.
Given ongoing geopolitical tensions and policy uncertainties, a bullish outlook for gold in 2026 and 2027 seems well justified. This view is shared by notable precious metals expert Jeff Christian of CPM Group.
A Long-Term View: Gold Price Charts
Examining the 20-year monthly gold price chart reveals compelling patterns:
A secular cup-and-handle formation from 2011 to 2024
A prolonged 10-year “cup” phase, a typically strong bullish signal
A breakout to new all-time highs in April 2024
Currently, gold is in a consolidation phase following this breakout. While this pause may last several months or quarters, the long-term technical structure points to a continued bullish trend, particularly with support around the $3,000 per ounce level. This setup underpins a positive gold price forecast for 2026 and beyond.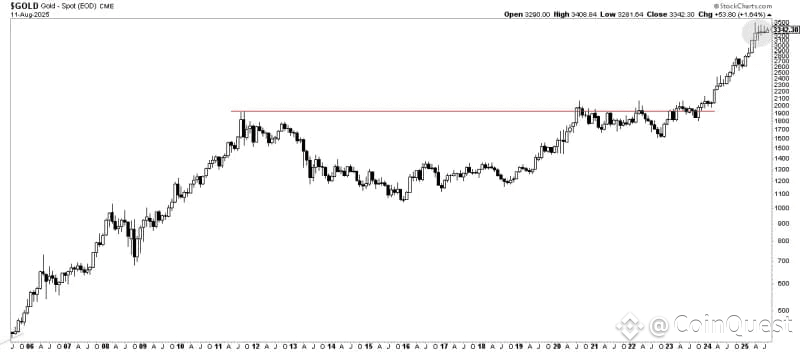
gold price breakout
Source: StockCharts.com
Gold and Its Correlation With the Monetary Base
Instead of focusing solely on gold’s price chart, it's valuable to examine metrics that provide clues about potential price direction. One measurement that has historically demonstrated reliability is the relationship between gold prices and the monetary base. Gold is often viewed as an inflation hedge and an alternative store of value to fiat currency. When the monetary base expands—meaning more money circulates in the economy—gold prices have tended to rise as well. Although gold and the U.S. dollar are no longer directly linked, there remains an indirect connection driven by monetary policy.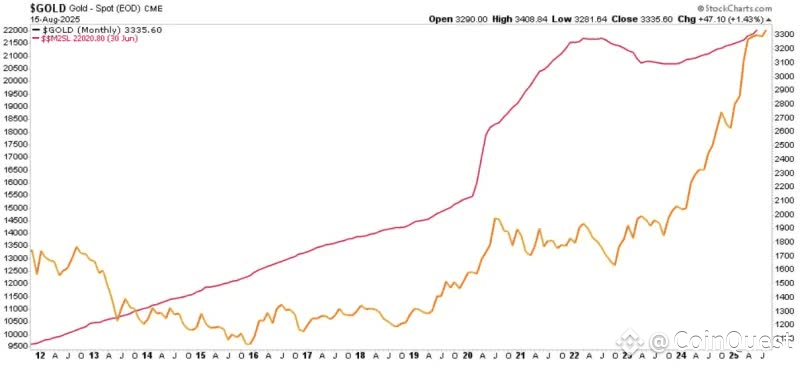
gold m2 money supply
Source: StockCharts.com
The correlation is particularly evident over long-term periods. While gold and the monetary base may not move in tandem on a daily or weekly basis, persistent growth in the monetary base has typically led to a bullish outlook for gold over time. This suggests the projected expansion of the monetary base supports a positive long-term gold forecast.
Gold and Its Link to Inflation Expectations (TIPS)
Another important correlation is between the price of gold and Treasury Inflation-Protected Securities (TIPS), which reflect inflation expectations. As inflation forecasts rise, gold prices also tend to increase, as the metal serves as a store of value when currency purchasing power falls. Trends in the gold-to-TIPS ratio typically offer a bullish signal for gold, tracking anticipated inflation over time.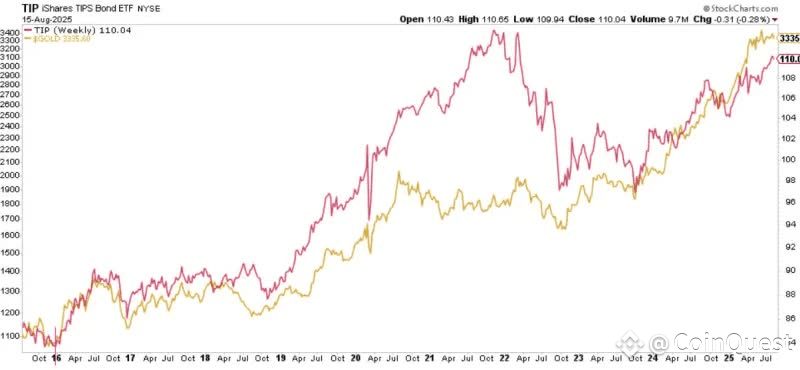
gold inflation expectations
Source: StockCharts.com
Gold and the EUR/USD Exchange Rate
The EUR/USD exchange rate has an important long-term correlation with gold prices. Since gold is priced in U.S. dollars, a rising EUR/USD (a weaker dollar) typically drives gold higher by making it more affordable to other currency holders. Although short-term movements may vary, a sustained downtrend in the dollar supports gold’s bullish trend. Current EUR/USD patterns show a strong base after a decade-long consolidation, suggesting limited downside risk. Coupled with geopolitical and inflation concerns, a softer dollar enhances gold’s appeal as a safe haven. Overall, EUR/USD trends are a key leading indicator supporting a positive gold outlook for 2026 and beyond.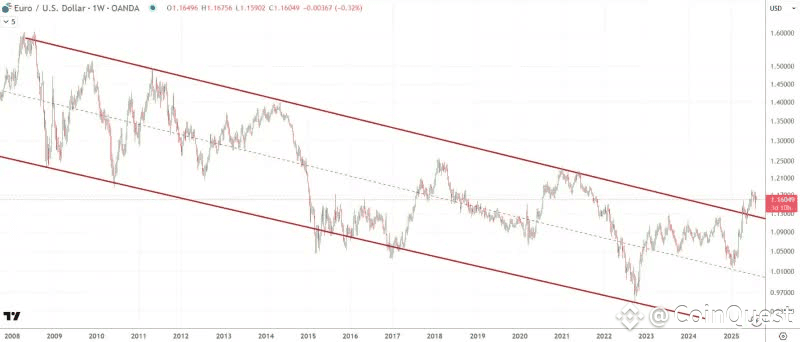
gold eurusd
Source: TradingView
What stands out about the long-term EUR/USD chart:
The current consolidation phase has lasted for about 10 years, providing significant support below the current levels.
The EUR/USD appears to be ending its prolonged downtrend, as indicated by a breakout from the downward channel.
Although there may be a possible decline of up to 10%, even this would likely be insufficient to disrupt the long-term upward trend in gold prices. It’s estimated that only a sustained EUR/USD decline of 15% to 20% or more would pose a serious threat to the bullish momentum of gold.
Considering the observations outlined above, we believe it offers reliable evidence that the expected gold price trend is up, directionally, in 2026 and beyond.
Gold Futures Market: Intramarket Indicators
While correlations with external factors are valuable, internal dynamics in the gold futures market are also informative. One key signal is the concentration of short positions, which often coincides with local peaks in gold prices. Since 2024, however, a reduction in concentrated short positions has accompanied gold’s breakout, providing further runway for price growth. High short concentration tends to cap gold’s potential, so the current environment with reduced short interest is supportive for further gains.
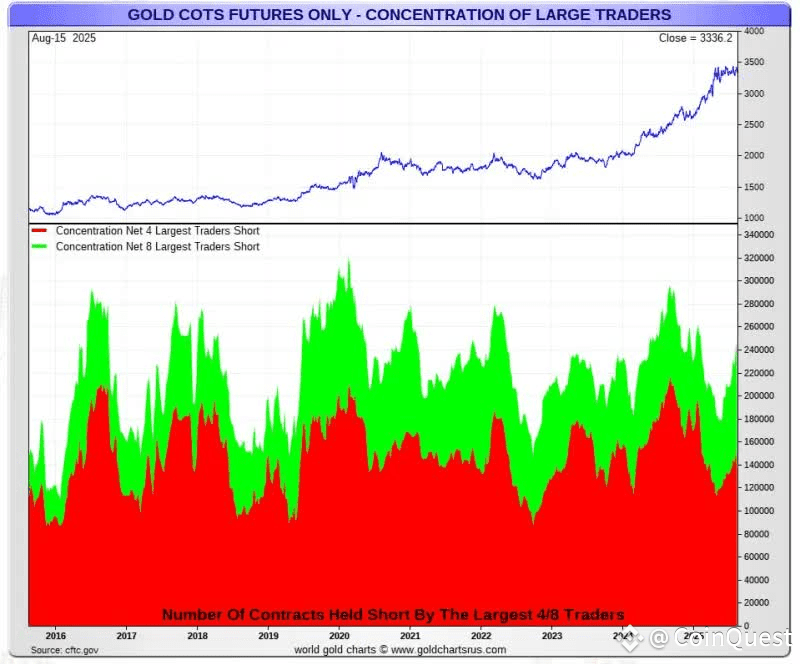
gold short interest
Source: Goldchartsrus.com
Gold Price Outlook for 2026: Summary and Expectations
In summary, while gold may face resistance or retrace over the short or medium term, the long-term outlook remains bullish. The principal drivers for sustained strength in gold include continued monetary base expansion, rising inflation expectations, supportive EUR/USD trends, and favorable futures market positioning. Short-term volatility is always possible, and gold could consolidate around the $3,000 level, but the prevailing direction over the next several years appears upward. The indicators mentioned provide directional, rather than precise timing, signals for the gold market.
