📈 Technical Analysis: 9 Powerful Bullish Patterns Every Trader Should Know
In the market, it's not necessary to guess — it's enough to learn to recognize patterns. Today we will analyze 9 popular bullish chart patterns that traders use to enter the market with minimal risk and maximum potential profit.
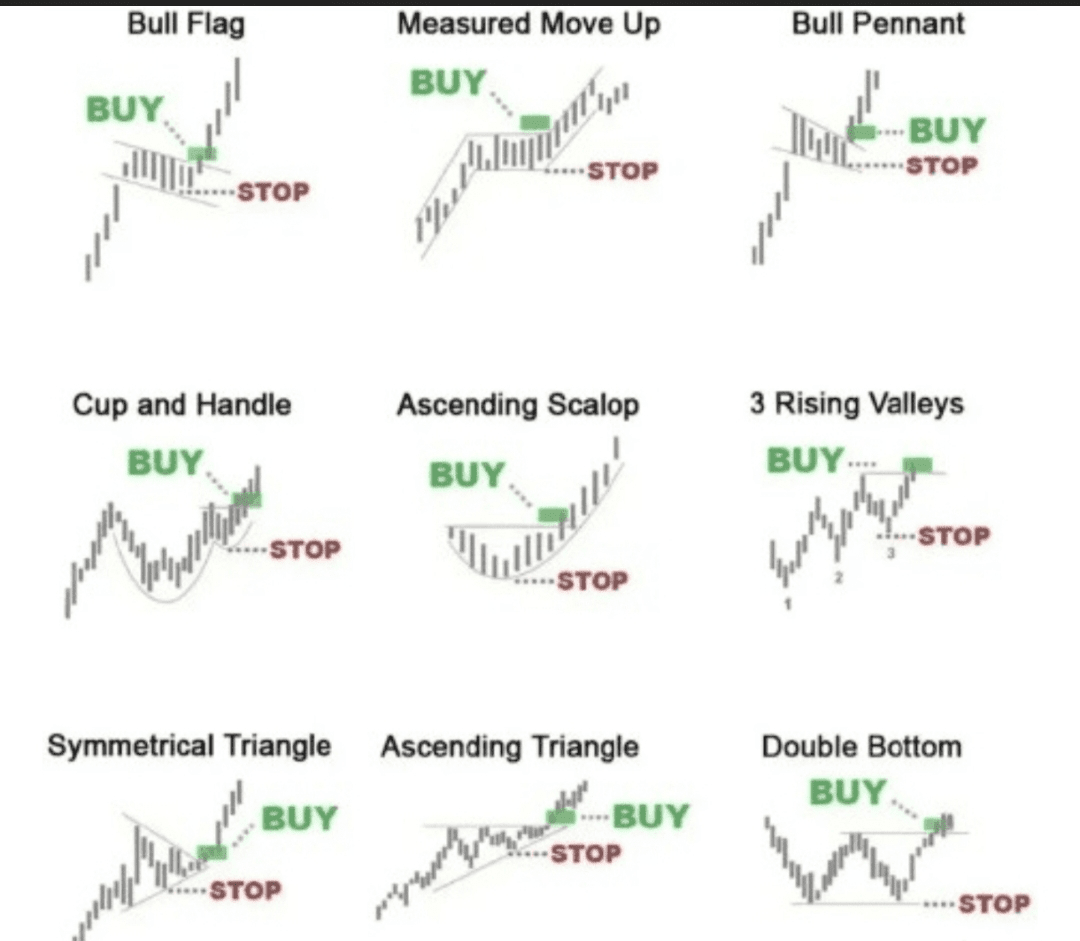
📊 What do the patterns show?
The image above presents chart formations that most often indicate the continuation of an upward trend or a reversal upward. Each pattern includes:
📍 entry point (BUY)
⛔ recommended stop-loss (STOP)
📈 expected price movement
🔍 Pattern analysis:
1. Bull Flag
After a sharp rise, the price pulls back slightly in the form of a "flag". If the upward breakout is confirmed — it's a good entry point.
2. Measured Move Up
Three waves of growth with corrections in between. Each movement is strong, with a clear upward trend.
3. Bull Pennant
Converging triangle after an uptrend. An upward breakout signals the continuation of the momentum.
4. Cup and Handle
Classic reversal pattern. Forms as a U-shaped "cup" followed by a small sideways pullback (the "handle").
5. Ascending Scallop
The price forms a "spoon" — a sharp rise, a smooth pullback, and then up again.
6. 3 Rising Valleys
Gradually rising lows are a sign that selling pressure is decreasing.
7. Symmetrical Triangle
If the price is compressing in a triangle and breaks upward — it's a signal for trend continuation.
8. Ascending Triangle
Horizontal resistance and rising support. A breakout at this level often leads to explosive growth.
9. Double Bottom
Reversal pattern. Two troughs form at the same level, after which the price shoots up.
If you liked the content, write "Ready" and click "subscribe", "like", "comment", and "share" with others. Thank you!❤️