Got it 👍
Bubble Maps (Bubblemaps) and blockchain data visualization:
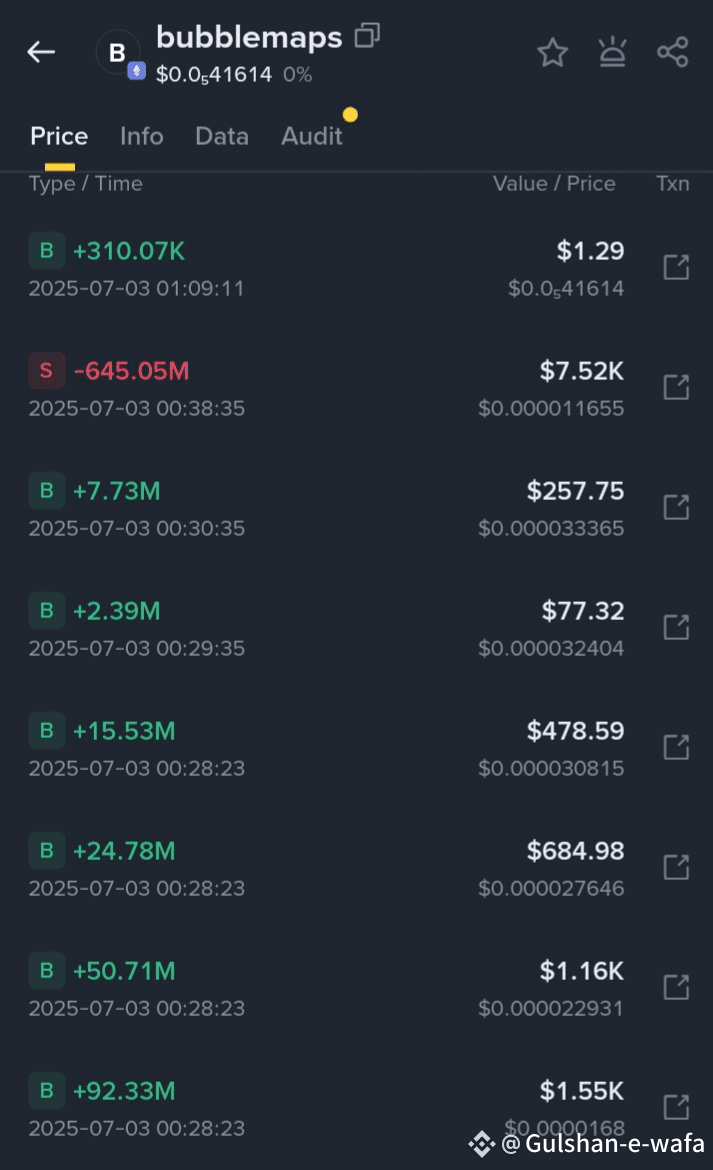
🟣 Bubblemaps – Visualising Blockchain Data
🟣Definition: Bubblemaps are a blockchain data visualization tool that uses clustered bubbles to represent wallets, token holders, and on-chain activity.
💡Purpose: They help detect patterns such as whale concentrations, suspicious wallet connections, insider holdings, and liquidity distribution.
🎯How it works:
Each bubble = one wallet address.
Size of bubble = size of holdings or transaction volume.
Connections (lines) show relationships between wallets (e.g., frequent transfers, shared origins).
Use cases:
1. Token Distribution → See if supply is controlled by few wallets.
2. Whale Tracking → Spot early movers, big buyers/sellers.
3. Transparency → Projects can display fair or suspicious distribution.
4. Risk Assessment → Identify potential rug pulls, manipulation, or hidden teams.
💥✅️Benefit: Simplifies complex blockchain data (millions of transactions) into a visual cluster that’s easy to interpret.
✅️💥(visual sketch) showing:
Bubbles (wallets) → sized by holdings
Connections (lines) → transfers or links
Clusters → whales, insiders, or groups
Labels → “Whale wallet,” “Public holders,” “Liquidity pool”
✅ In short: Bubblemaps turn blockchain addresses & transactions into an interactive visual "map," making it easier to spot hidden connections, whale control, or unhealthy token distributions.@Bubblemaps.io
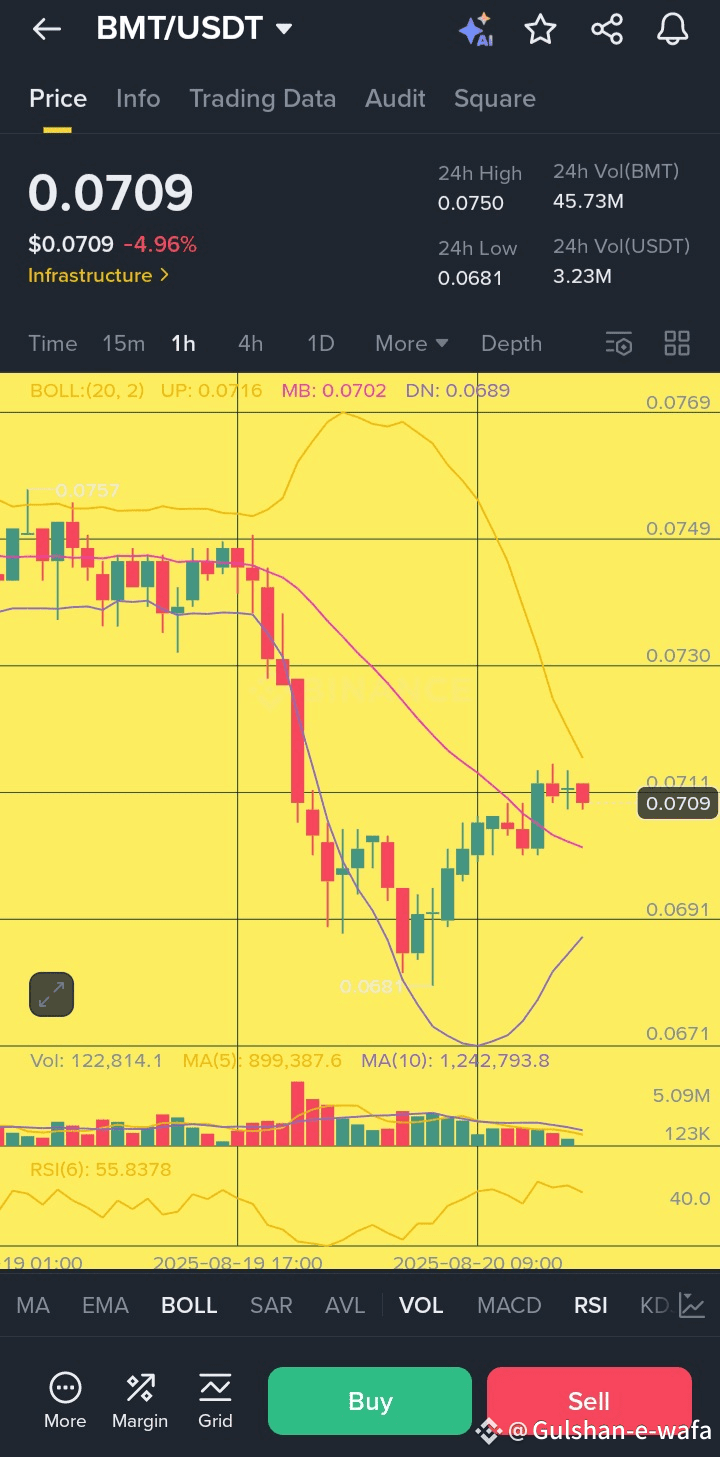
Got it 👍 let’s break this BMT/USDT 1-hour chart down quickly:
📊 Key Observations
Price: $0.0709 (down -4.96%)
Range: 24h High = $0.0750, 24h Low = $0.0681 → fairly tight range.
Trend: Strong drop earlier, then small recovery candles forming (possible short-term bottoming).
Moving Averages:
MA(5) ≈ 0.0716 (above price → slight pressure)
MA(10) ≈ 0.0729 (above price → resistance zone)
Bollinger Bands (BB):
Upper: 0.0716
Middle: 0.0702
Lower: 0.0689
→ Price hovering near the middle band after bouncing off the lower band. Neutralizing after oversold.
RSI (6): 55.8 → momentum is neutral to slightly bullish (not overbought/oversold).
Volume: Spike seen during the dip recovery → suggests buyers stepped in near 0.0681.
📝 Insight
The coin dumped hard but found short-term support around 0.0681.
Now consolidating just above MA(5) and the Bollinger middle band → could test 0.0730 resistance if momentum continues.
If it fails to break 0.0715–0.0730, risk of retesting support at 0.0690–0.0680.
👉 Short-term traders: Watch 0.0715–0.0730 zone → breakout could give small upward move.
👉 Risk: Falling below 0.0680 may open further downside.