Current Price: $180.87 (+0.64%)
Solana is testing a critical support zone on the 4-hour chart, and the next move could decide whether the bullish trend continues or momentum flips in favor of the bears.
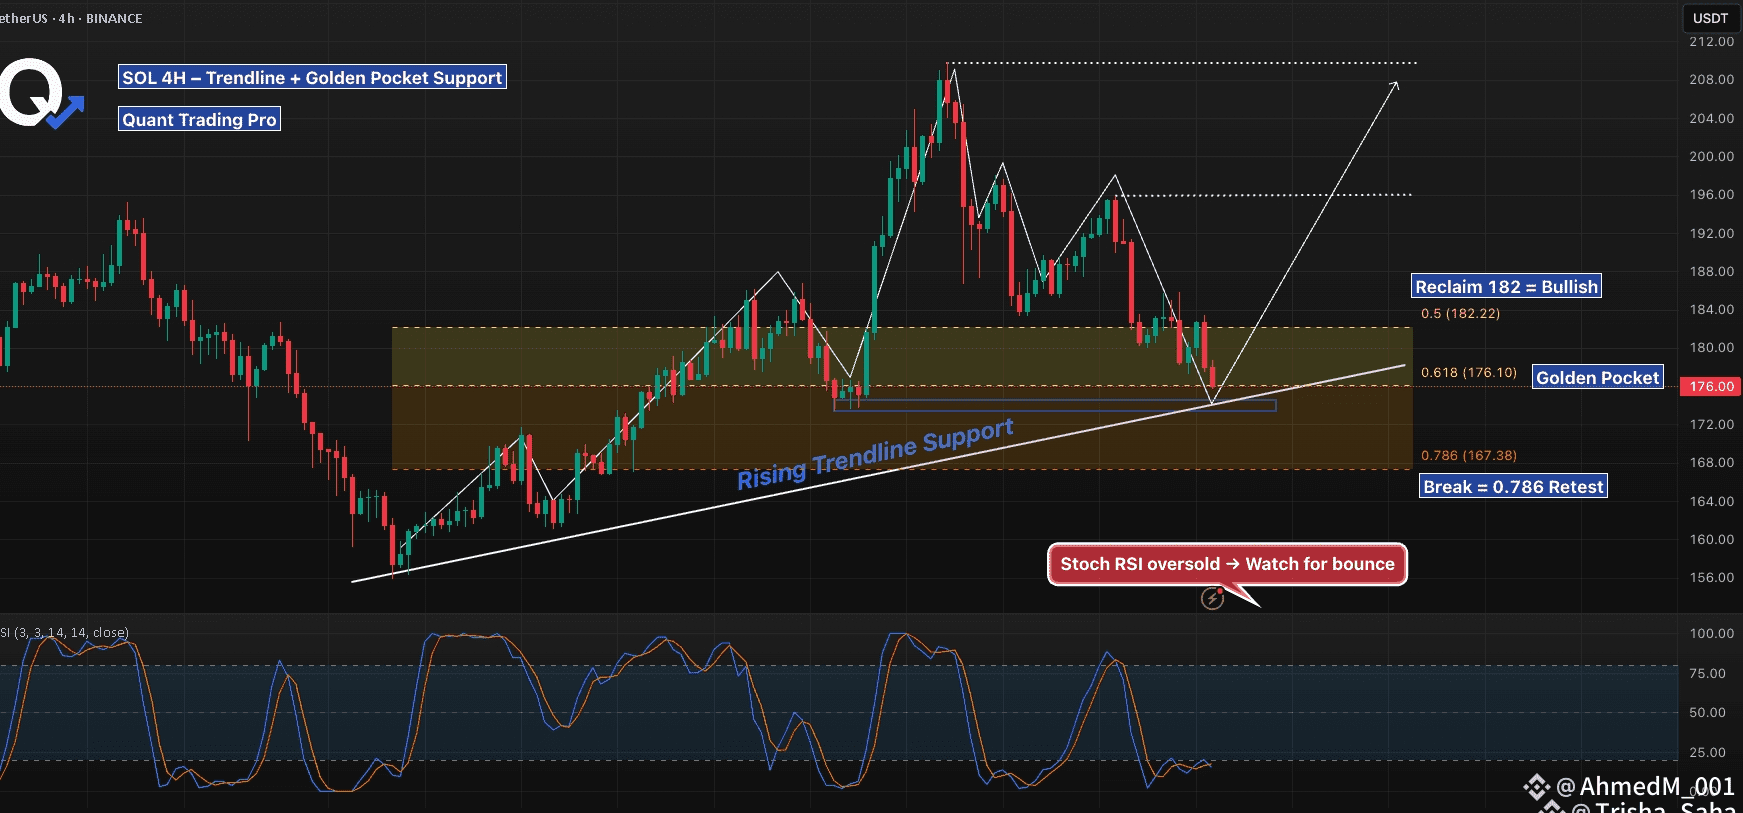
At the moment, $SOL has retraced into the 0.618 Fibonacci level around $176, which also aligns with a rising trendline that has guided price action in recent weeks. This confluence makes the zone extremely important for short-term direction.
Adding further intrigue, the Stoch RSI is oversold, suggesting sellers may be running out of steam and giving bulls a chance to step in.
Scenarios to Watch
Bullish Case: If buyers defend $176 and push back above $182, it would confirm a bounce and continuation of the uptrend. From there, upside targets sit in the $196–$212 range, where the next major resistance levels are clustered.
Bearish Case: On the flip side, if $SOL loses $176, the structure weakens. That breakdown could drag price toward the 0.786 Fibonacci retracement near $167, a deeper support level where buyers may attempt another defense.
Why This Zone Matters
This area is a true decision point for Solana. A successful hold would reinforce confidence in the ongoing bullish structure, keeping momentum with the bulls. But failure to defend could signal the beginning of a broader pullback and shift short-term sentiment bearish.
📊 Traders should pay close attention to how $SOL reacts here — the battle between bulls and bears is heating up, and the outcome will set the tone for the next leg of price action.