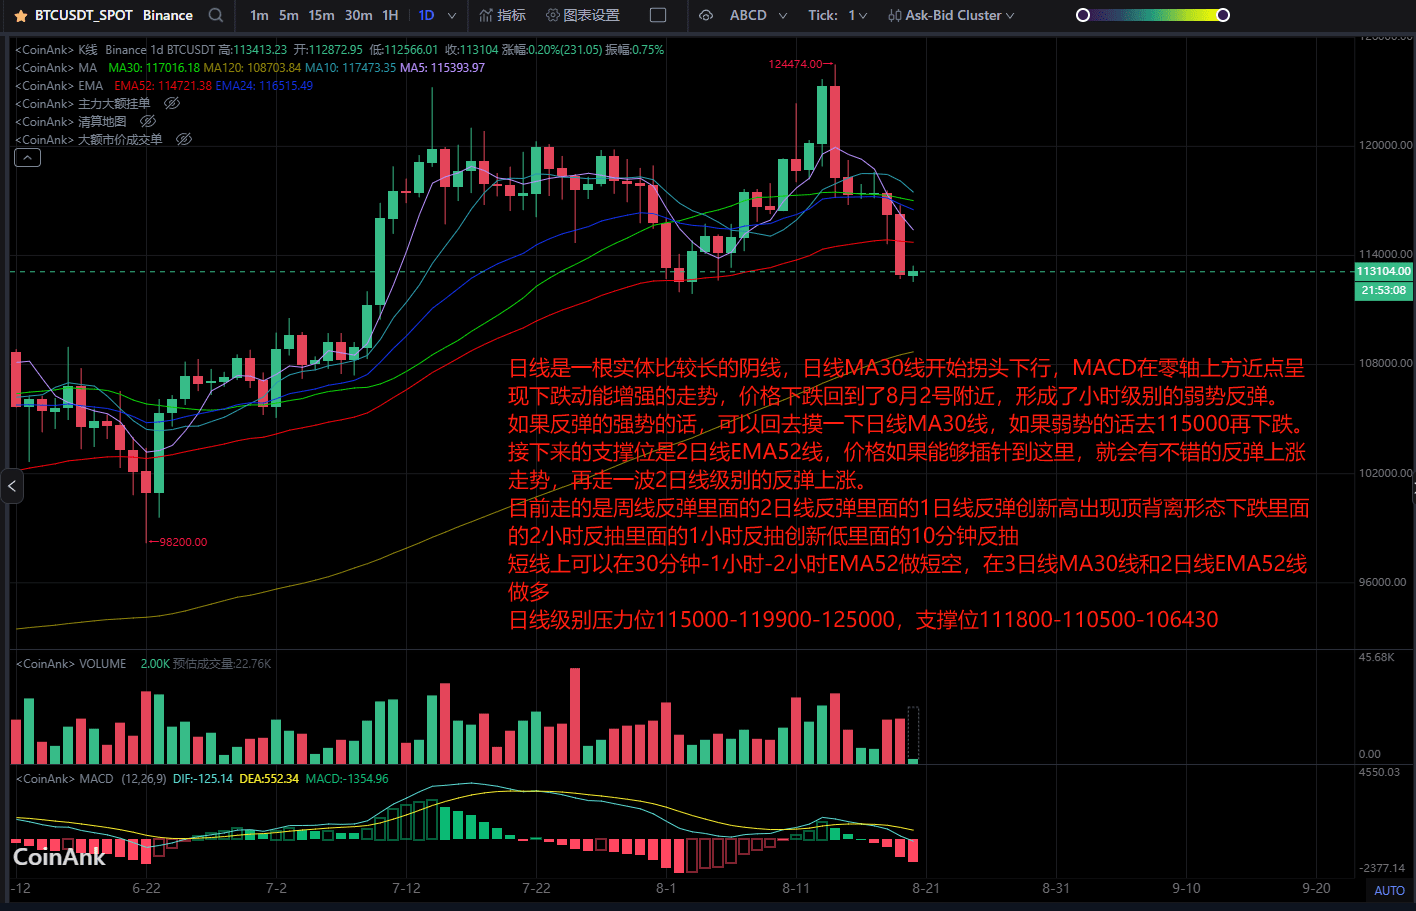
The daily chart shows a relatively long bearish candlestick, the daily MA30 line has started to turn downward, and the MACD is showing a strengthening downward momentum above the zero line, with prices falling back to around August 2, forming a weak rebound on the hourly level.
If the rebound is strong, it can go back to touch the daily MA30 line; if weak, it will drop to 115000 before falling further.
The next support level is the 2-day EMA52 line; if the price can spike down to this level, there will be a good rebound trend, followed by a wave of rebound on the 2-day level.
Currently, it is in a weekly rebound within a 2-day rebound, a 1-day rebound has reached new highs showing a top divergence pattern, with a drop within a 2-hour pullback and a 1-hour pullback reaching new lows within a 10-minute pullback.
In the short term, one can short at the 30-minute-1 hour-2 hour EMA52, and go long at the 3-day MA30 line and 2-day EMA52 line.
Daily resistance levels are 115000-119900-125000, support levels are 111800-110500-106430.