Bitcoin (BTC), the leading cryptocurrency by market capitalization, has shown some interesting price action over the past 24 hours. As of the latest data, BTC is trading at Rs32,462,883.47, which represents a slight decrease of -0.55% from its previous trading value. This decline, while relatively small, highlights the volatile nature of the crypto market, making it important for traders to monitor key price levels for potential breakout or breakdown scenarios.
Price Action Overview: Support and Resistance Zones
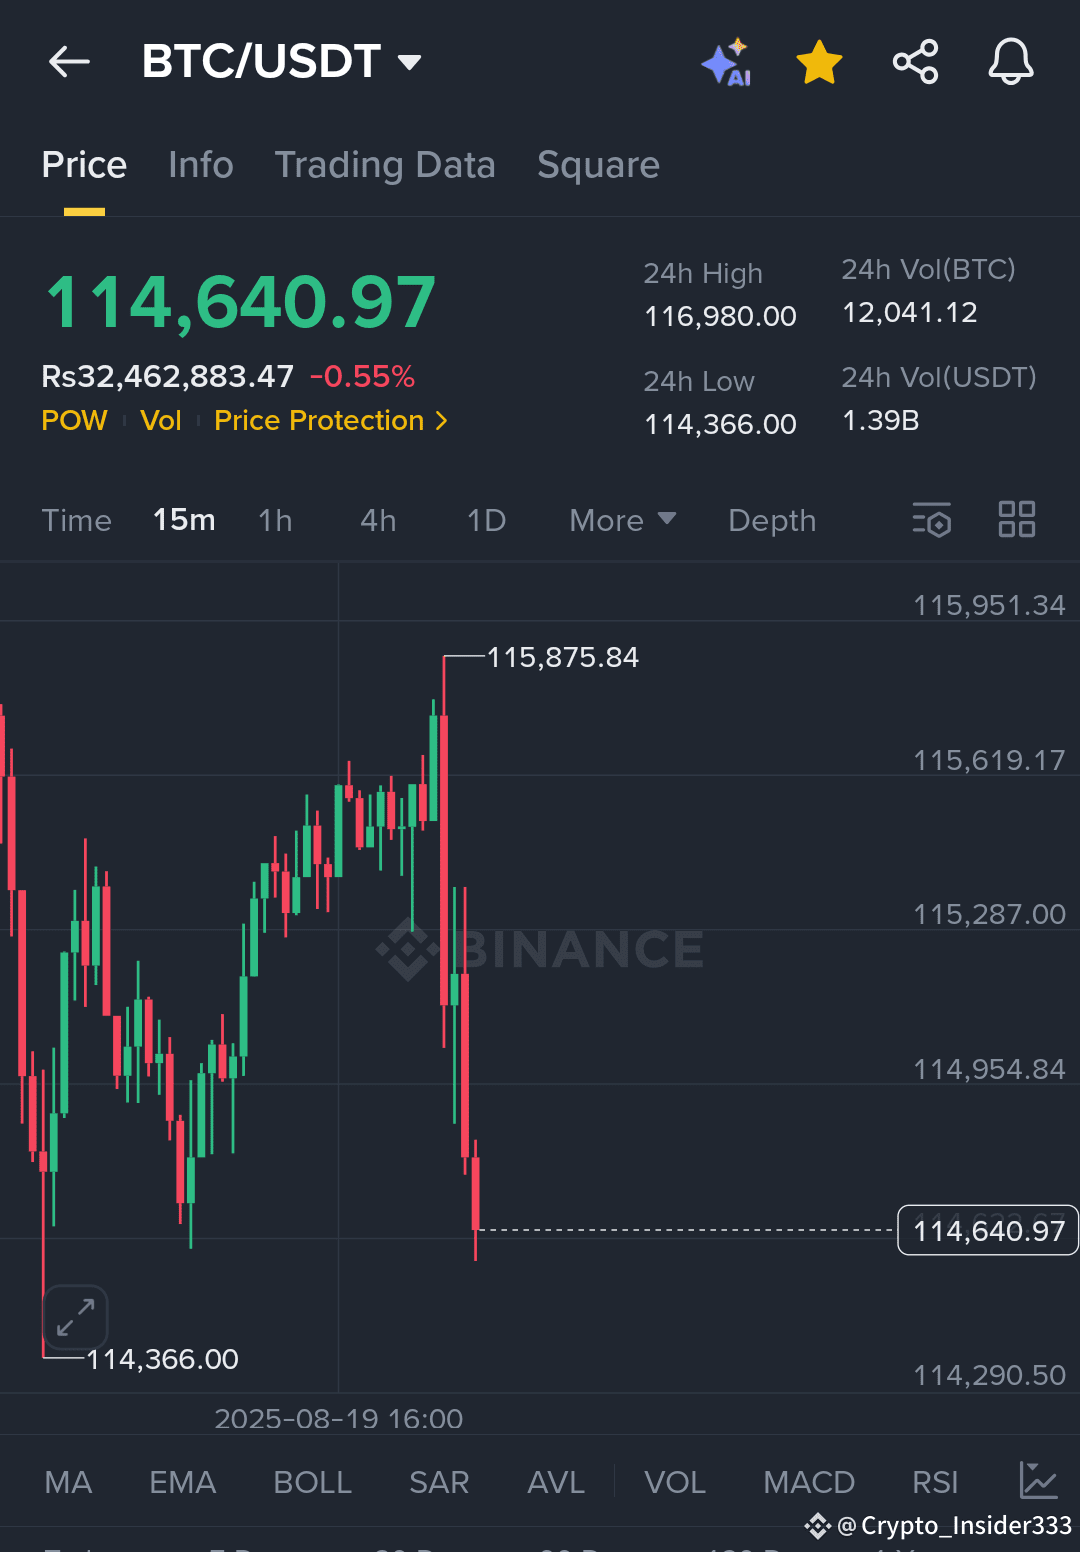
Looking at the 24-hour chart, Bitcoin has been fluctuating between a high of Rs116,980 and a low of Rs114,366. The price recently reached Rs115,875.84, where it encountered strong resistance, leading to a pullback. This resistance level is an important marker for traders to watch as a breakout above it could signal a continuation of the bullish trend.
Currently, BTC is trading near its support level of Rs114,640.97, just above the daily low. This level has proven to be crucial in the past as it has acted as a base for price movements. If BTC maintains its position above this support, it could see a rebound back towards Rs115,875.84, which is the immediate resistance. A successful break above this resistance could open the path towards the next higher resistance level around Rs116,980.
Analyzing Market Volume and Trend
With a trading volume of 12,041 BTC and a total 24-hour volume of 1.39 billion USDT, market participation remains strong. The volume data is important as it confirms the strength or weakness of price movements. In this case, the strong volume supports the idea that Bitcoin is still in play, with active buyers and sellers involved in shaping the price action.
The next 24 hours could be crucial for determining the short-term direction of Bitcoin's price. If BTC manages to stay above the support level of Rs114,640 and starts showing signs of a bullish reversal, traders may consider entering long positions. This would involve targeting resistance levels of Rs115,875 and Rs116,980, with a possible retest of the all-time high if the trend continues to the upside.
However, if Bitcoin fails to hold the Rs114,640 support and drops below Rs114,366, the bearish momentum could accelerate. In such a case, traders should be prepared for potential short opportunities, with the next support level acting as a key target for downward price action.
Key Takeaways for Traders
Monitor Support and Resistance Levels: Bitcoin is currently trading near a key support level of Rs114,640. If the price holds this level, a bounce toward resistance at Rs115,875.84 and Rs116,980 could be possible.
Volume Analysis: The 24-hour trading volume of 12,041 BTC and 1.39 billion USDT shows healthy market participation. A breakout above resistance should be accompanied by an increase in volume to confirm the trend.
Watch for Breakouts or Breakdowns: A breakout above Rs115,875.84 or Rs116,980 could signal a continuation of the bullish trend. However, if the price breaks below Rs114,366, a bearish move towards lower support levels is likely.
Risk Management: As always, risk management is key. Traders should be ready to adjust their strategies depending on the market’s reaction at key levels, setting stop losses to protect against adverse moves.
Conclusion
Bitcoin continues to navigate through a crucial price range, and traders should keep a close eye on the support and resistance levels discussed above. The market’s reaction in the coming hours will be critical in determining whether Bitcoin will continue its upward momentum or face a potential pullback. Traders should stay alert, use proper risk management strategies, and be ready to capitalize on any opportunities that present themselves based on Bitcoin’s price action and volume trends. As always, keeping a watchful eye on these key levels can significantly improve a trader’s chances of making profitable trades in the fast-moving crypto market.
