Wow, check out this XRP/USDC chart! 🚀
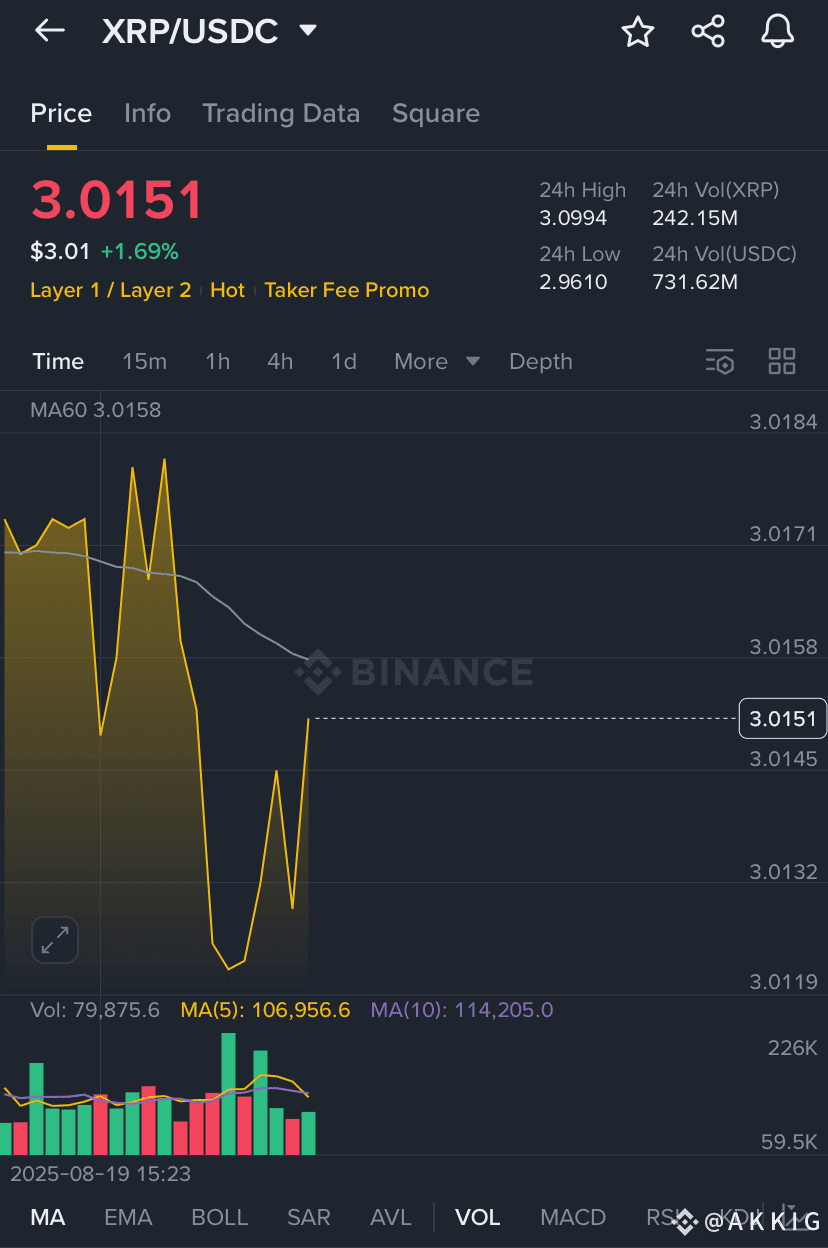
This is a wild ride. The price is currently sitting at $3.0151, which is up 1.69% over the last 24 hours. We're seeing some pretty significant volatility, with the 24h high at $3.0994 and the low at $2.9610. This kind of movement is where traders either make big gains or take some serious losses, so you've gotta be sharp.
The trading volume is also telling a story. We have 242.15M in XRP volume and a massive 731.62M in USDC volume. The high USDC volume suggests a lot of people are converting their assets, which could mean a bunch of things—either they're taking profits, or they're getting ready to buy back in. This is a key indicator to watch.
The chart shows the price just dropped hard, but it looks like it's trying to find support. It's dipping below the MA60 line, which is at 3.0158. That's a classic signal. When the price dips below this moving average, it can suggest a shift in momentum. You'll want to see if it bounces back and holds above that line.
Strategic Notes: 📝
* Be Patient: Don't FOMO in right after a big drop. Wait to see if it consolidates or shows a clear sign of a reversal.
* Watch the Volume: The massive USDC volume is a big deal. Keep an eye on the volume bars at the bottom. The green bars show buying pressure, and the red ones show selling pressure.
* Set Your Levels: Use the recent high and low as your reference points. Set a stop-loss order below the 24h low ($2.9610) to protect your capital. If it breaks above the 24h high ($3.0994), that could signal another leg up.
Remember,🧑💻 crypto trading is risky. Do your own research, manage your risk, and never invest more than you can afford to lose. Stay safe out there! ✌️
#BinanceHODLerPLUME #ETHInstitutionalFlows #PowellWatch