Solana starts a new round of decline from the $210 region. The SOL price currently shows bearish signs and may break below the support level of $172.
The SOL price against the US dollar has started a new round of decline after failing to break above $210.
The current price is below $185 and the 100-hour simple moving average.
On the hourly chart of SOL/USD, a connecting bearish trend line has formed, with resistance at $188 (data source: Kraken).
If the resistance zone at $188 is broken, the currency pair may begin a new round of rising.
Solana price declines again
The Solana price failed to break the $210 region and, like Bitcoin and Ethereum, has started a new round of decline. The SOL trading price has broken below the support levels of $200 and $188, entering a short-term bearish zone.
Bears have successfully pushed the price below the 50% Fibonacci retracement level of the uptrend from the low of $173 to the high of $209. A bearish trend line has also formed on the hourly chart of the SOL/USD currency pair, with resistance at $188.
Solana's current trading price is below $185 and the 100-hour simple moving average. It is also below the 76.4% Fibonacci retracement level of the uptrend from the low of $173 to the high of $209.
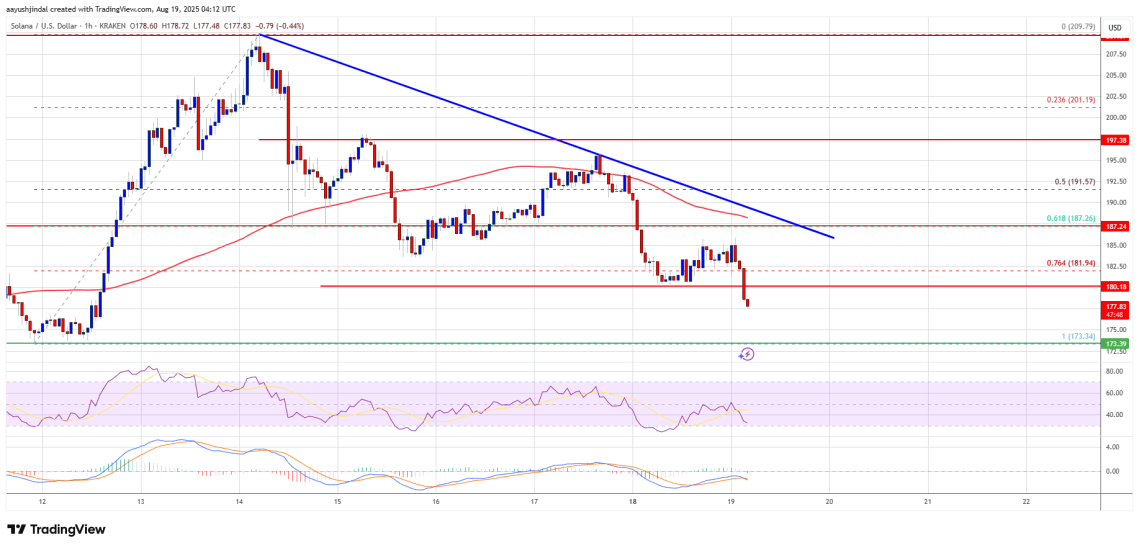
On the upside, the price faces resistance near $182. The next major resistance level is around $184. Major resistance may be at $188. If it successfully closes above the resistance level of $188, it could lay the groundwork for the next steady rise. The next key resistance level is at $192. If the price rises further, it may climb towards $200.
Does SOL lose more?
If SOL fails to break the resistance level of $182, it may continue to decline. On the downside, the initial support level is around $175. The first major support level is around $172.
Breaking below the level of $172 may push the price towards the support area of $162. If the closing price falls below the support level of $162, the price may drop to the support level of $150 in the short term.
Technical indicators
Hourly MACD - The MACD of SOL/USD is accelerating in the bearish zone.
Hourly RSI (Relative Strength Index) - The RSI of SOL/USD is below the 50 level.
Major support levels - $172 and $162.
Major resistance levels - $182 and $188.

