
The cryptocurrency market is under slight selling pressure as Ethereum (ETH) dropped 4% in a day, falling to $4,350 from a recent high of $4,780. This decline has spilled over to major altcoins, with XRP also trading lower.
Currently, XRP has decreased by about 4% this week, but beneath the surface, a recognizable harmonic pattern is forming on the chart - a pattern that could signal a potential bullish move in the coming days.
Harmonic Pattern Suggests Potential Bullishness
On the daily chart, XRP is forming a Harmonic Bearish Butterfly pattern. Although labeled "bearish", this pattern often precedes subsequent bullish rallies in the later stage (CD), when the price extends into the Potential Reversal Zone (PRZ).
The formation process begins at point X ($3.66), then drops to A, rebounds to B, and undergoes another correction to C near $2.94. From that point, XRP started to recover, currently trading around $3.05.
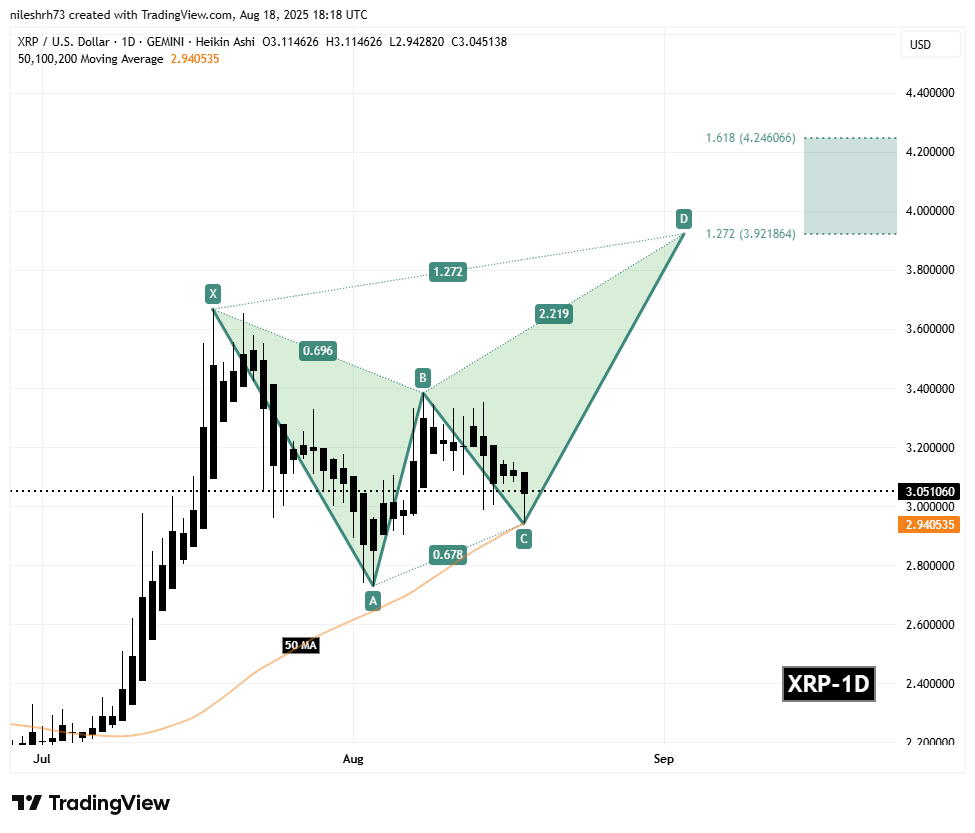
More importantly, this token has defended the 50-day moving average (MA) at $2.94, which serves as a short-term support area. Maintaining above this level strengthens the bullish outlook for XRP's next rally.
What is the Next Step for XRP?
If buyers can maintain control above the 50-day MA and support point C ($2.94), XRP could move towards the PRZ, extending from $3.92 (Fibonacci extension 1.272) to $4.26 (Fibonacci extension 1.618). Historically, these levels serve as key completion targets for the Butterfly pattern, often marking areas where momentum either consolidates or reverses.
On the downside, if it fails to maintain above $2.94, the harmonic structure will weaken, potentially delaying or invalidating the bullish breakout scenario. While risks remain, the technical setup suggests that XRP may be quietly preparing for a larger move as this harmonic pattern develops.

