
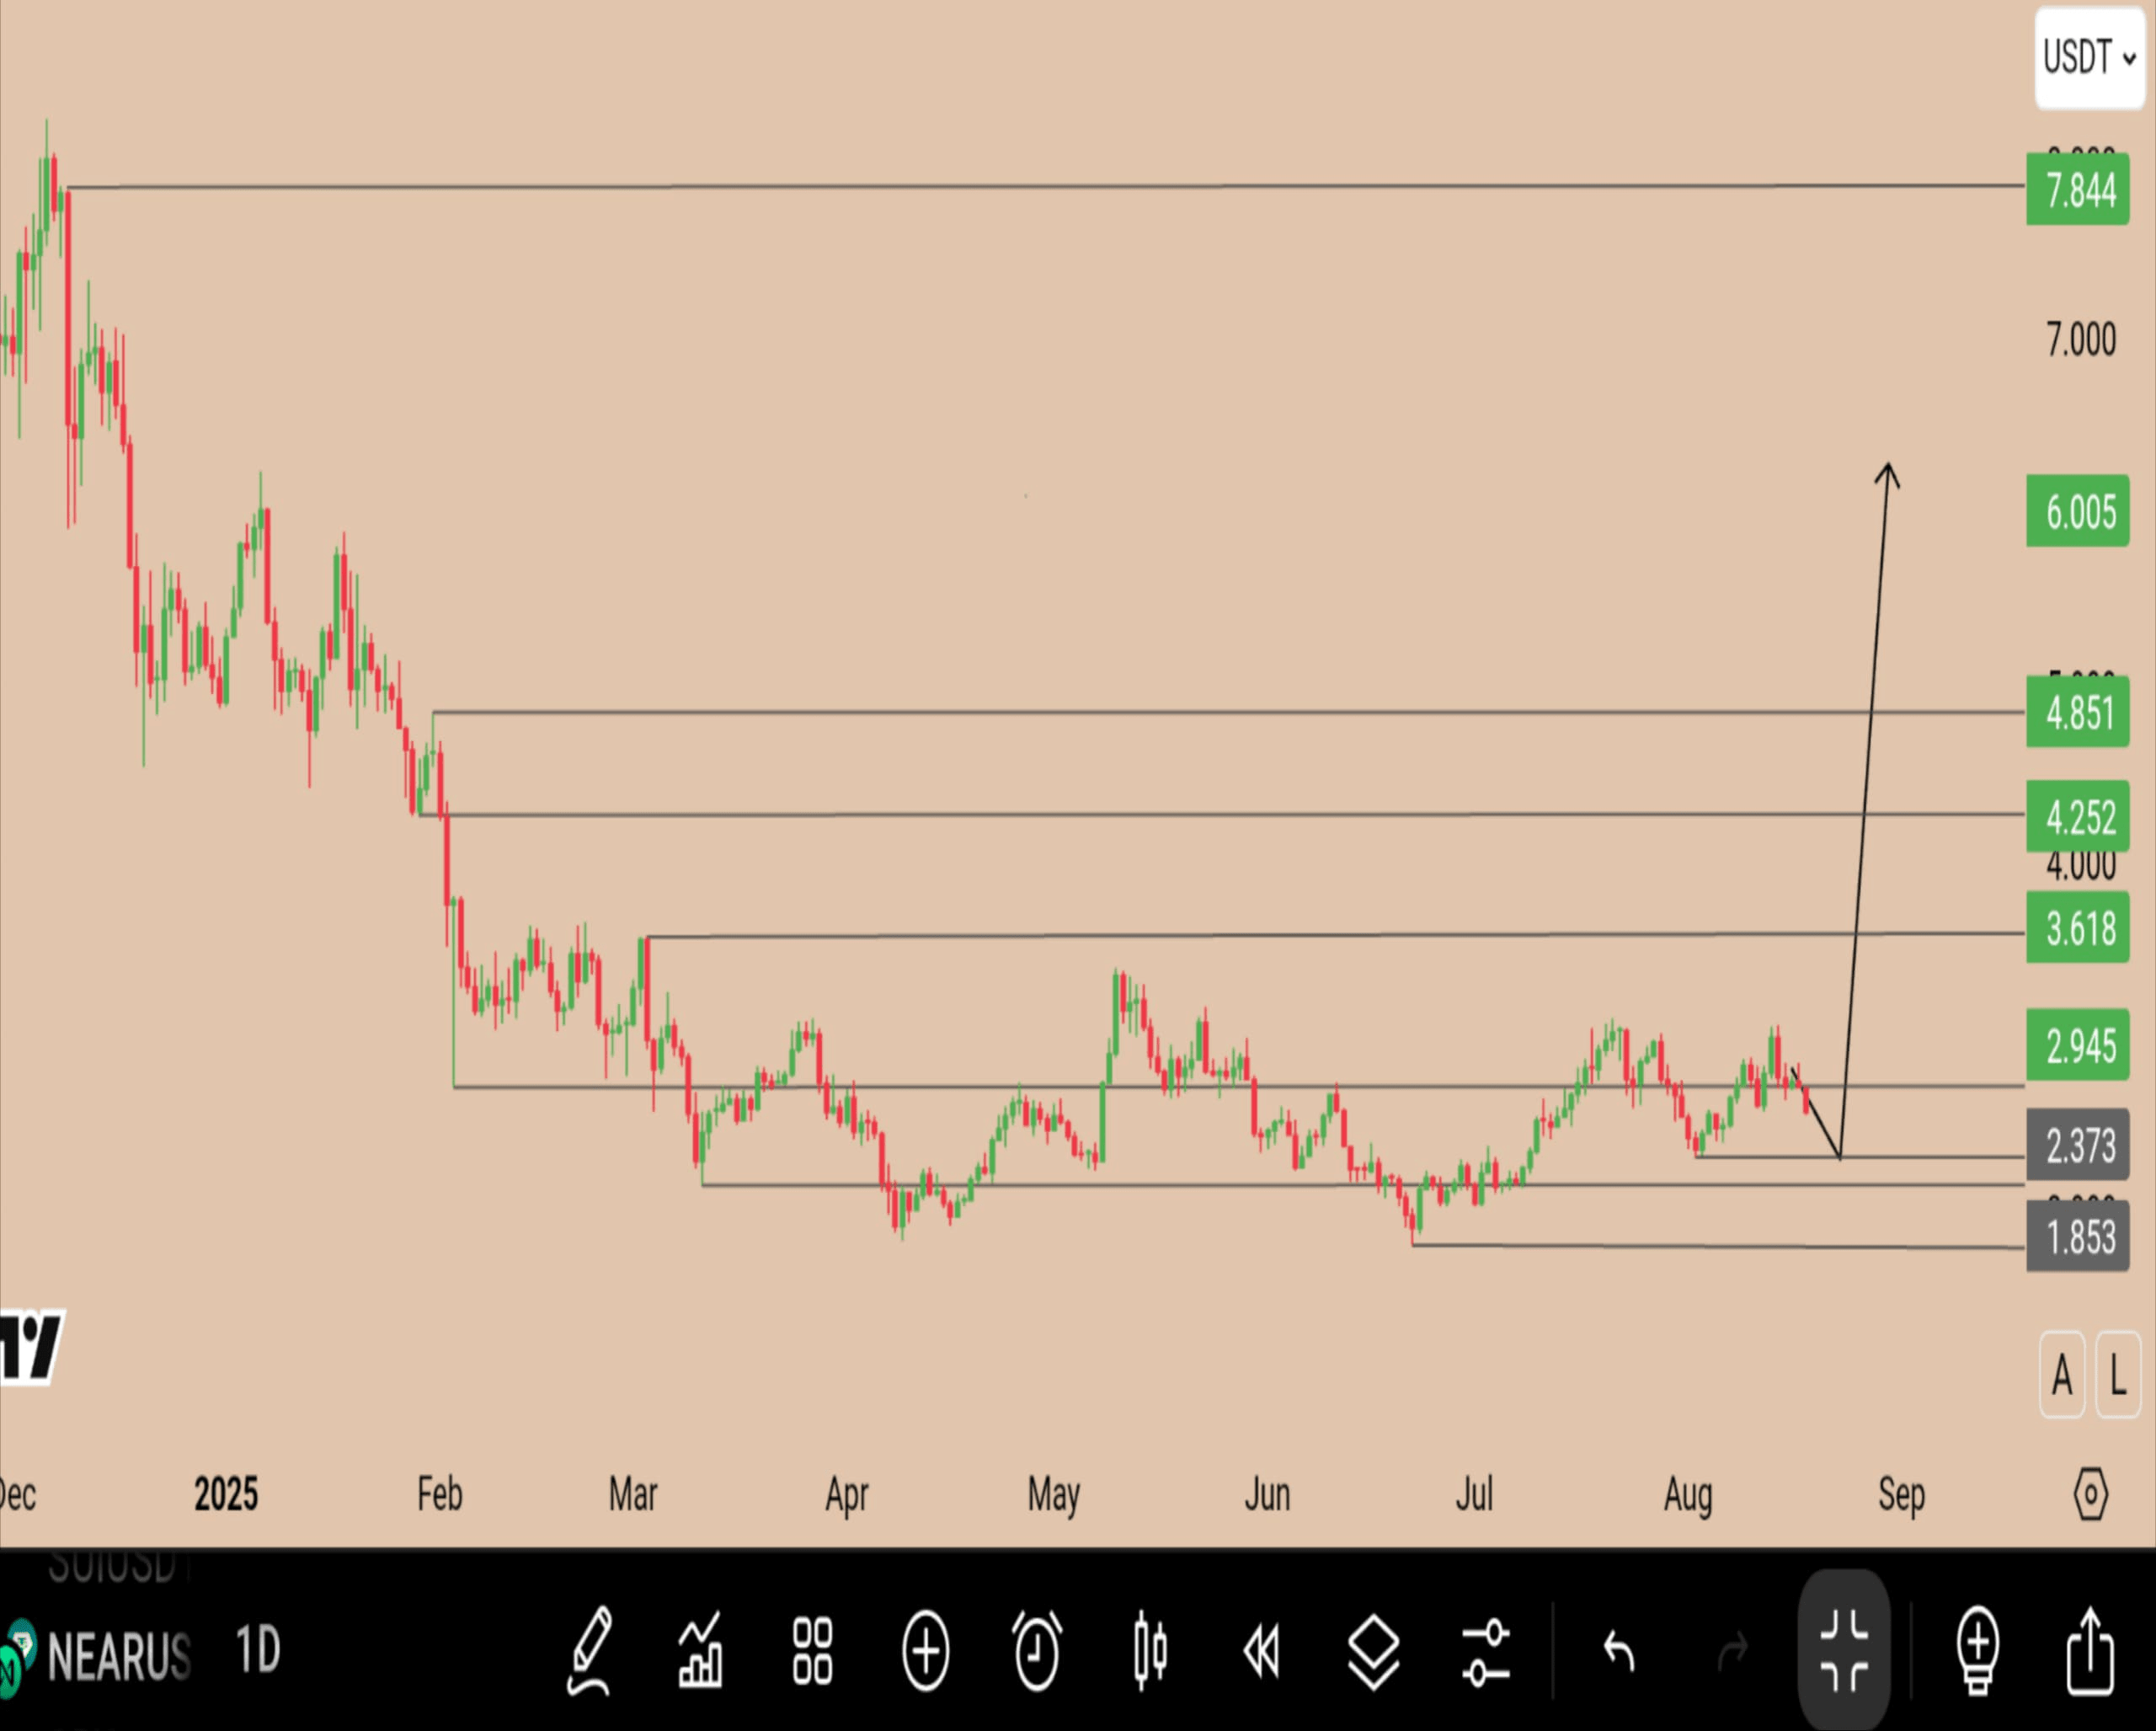
The price is moving within a consolidation range between $1.85 and $2.95 with a possible “sweep” to short bottoms towards $2.37 → $1.85 before an expansionary push targeting the $3.62 → $4.25/$4.85 → $6.00 areas.
The overall picture
After an early downtrend this year, the price has formed a clear trading range:
Range Bottom: $1.85 • Range Mid/Dynamic Support: $2.37 • Range Ceiling: $2.95.
Price action is showing higher highs and lows since June with regular bounces from demand zones, suggesting a liquidity buildup scenario before a breakout.
Supply and Demand Zones (Pivot Levels)
Order: $2.37 then $1.85 (bottom of range and strongest defense).
Display/Targets: $2.95 (Range Cap) → $3.62 → $4.25–$4.85 → $6.00 (Stretch) then $7.84 (Stretch Target).
Motion Scenario (SMC/PA)
1. Sweep and Go Scenario (Preferred):
A quick drop to test $2.37 and may extend to $1.85 to draw liquidity, then a strong reversal breaks $2.95 and launches an expansion wave towards higher targets.
2. Direct hacking scenario:
A clear daily close above $2.95 with a successful retest will trigger a push to $3.62 → $4.25/$4.85 and then $6.00.
Educational Trading Plan
Plan A — Buy the Reversal from the Demand
Entry Zone: $2.37–$2.20 (Focus on engulfing signal/structural shift on 4H).
Invalidation: Daily close below $1.83.
Objectives:
T1 $2.95 (Range Cap)
T2 3.62$
T3 $4.25–$4.85
T4 $6.00 (Extension)
Trade management: Move the stop to the entry point after T1, and take 25–30% at each target.
Plan B — Break and Confirm
Trigger: Daily close above $2.95 + successful retest.
Reference stop: below $2.78.
Goals: Same as above with acceleration to $3.62.
What invalidates the vision?
A clear daily close below $1.83 means a failed bottom/postponed breakout and a possible deeper requote.
Quick Notes
Watch for the bounce coinciding with the tails of the candles on the supports (active demand signal).
Bitcoin's liquidity and direction will affect how quickly targets are reached.
Splitting your entry and adhering to strict risk management (1–2% of your capital per trade) is the difference between a good trade and a safe account.
This is an educational analysis based on price action and the horizontal areas shown in the chart. It is not investment advice. Good luck 🙏📊