
Bitcoin has triggered its fourth Golden Cross on the weekly chart, a technical signal when the 50-week moving average crosses above the 200-week moving average. This event has only occurred three times in BTC's history — in 2016, 2019, and 2020 — each followed by strong price rallies. According to data shared by Merlijn The Trader, these previous signals preceded price increases of +264%, +2,200%, and +1,190%, respectively.
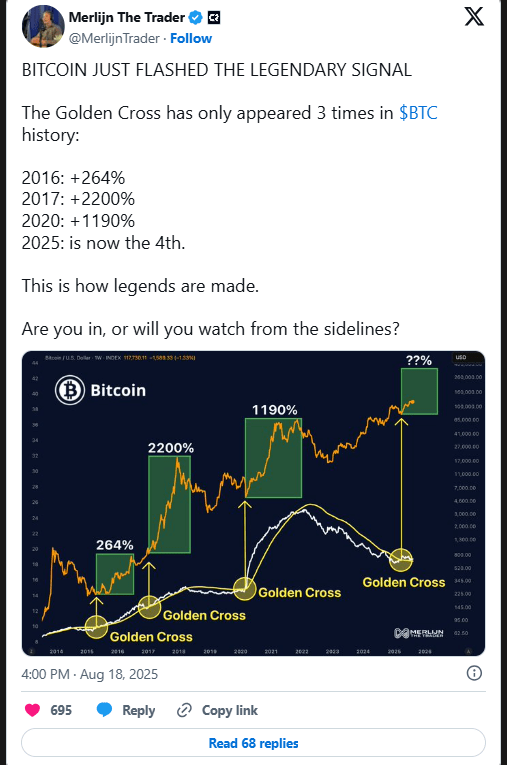
Bitcoin is currently trading around $115,118. Although previous Golden Crosses have led to strong bull markets, no percentage forecast has been provided for the current signal. The chart shows a big question mark for the 2025 cycle, creating an opportunity for speculation on how the market may react.
Holder Structure Balances Market Dynamics
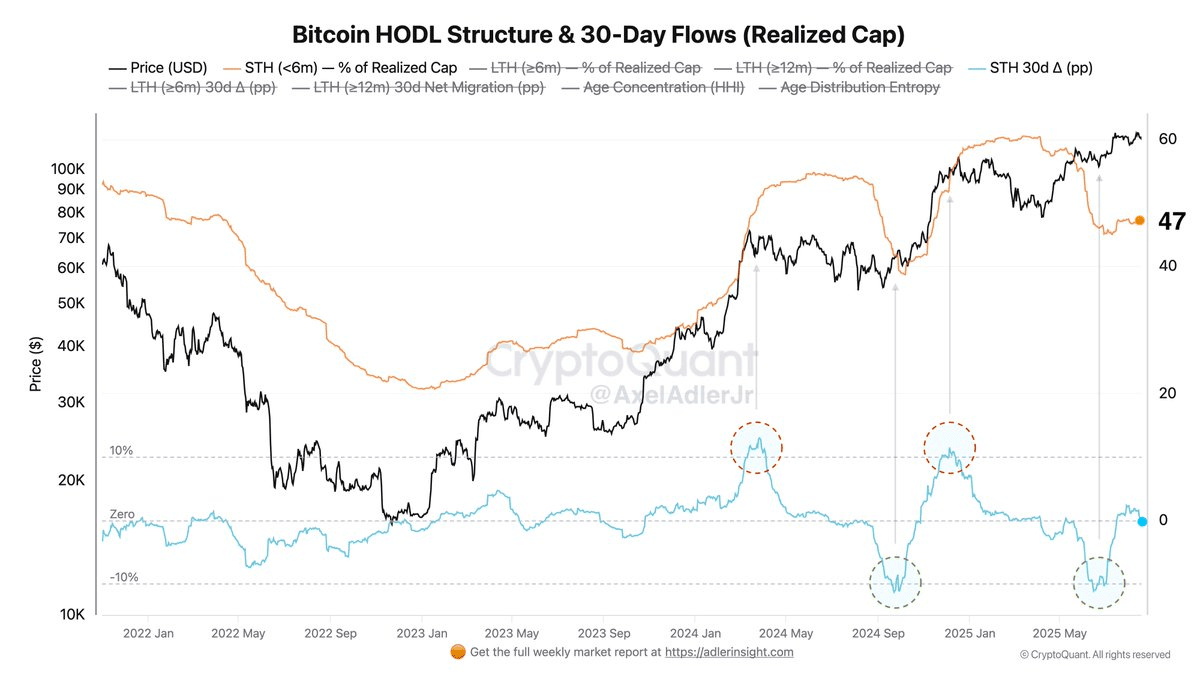
On-chain data from analyst Axel Adler Jr. shows that the holder structure of Bitcoin is currently balanced. The ratio of short-term holders (STH) - defined as wallets holding BTC for less than six months - is 47%.
Meanwhile, the 30-day volatility of STH stock (STH 30d Δ) remains at 0. This means there has been no significant change between short-term and long-term holders over the past month.
Historically, STH 30-day Δ peaks above +10% often coincide with local peaks, while drops below -10% typically occur during early capitulations and recoveries. A value of 0 at the all-time high indicates neutral market pressure. According to the analyst, "A 0 Δ value at ATH represents a balanced mode," suggesting that the fundamental case is sideways accumulation.
Liquidity Decreased on Binance
An adjusted indicator called "Purchase Strength Ratio" (Net Stablecoin Flow / BTC Outflow) from Binance indicates a significant decrease in exchange liquidity. On August 14, this ratio surged to 2.01, reflecting strong buying power. Within 48 hours, it dropped to -0.81, signaling a liquidity reversal as outflows exceeded inflows.
This ratio decline occurred before the BTC price dropped from over $120,400 to below $118,000. Analysts view this indicator as a leading signal for market correction. One analyst commented: "This ratio decline is a direct and actionable signal."
Outlook Remains Cautious
Although the Golden Cross marks a bullish technical pattern, the lack of volatility among holders and reduced liquidity suggests that the next big move may not happen immediately. Market participants are closely monitoring both technical signals and chain signals to determine whether a new price rally will occur or if further consolidation lies ahead.
