Overall trend:
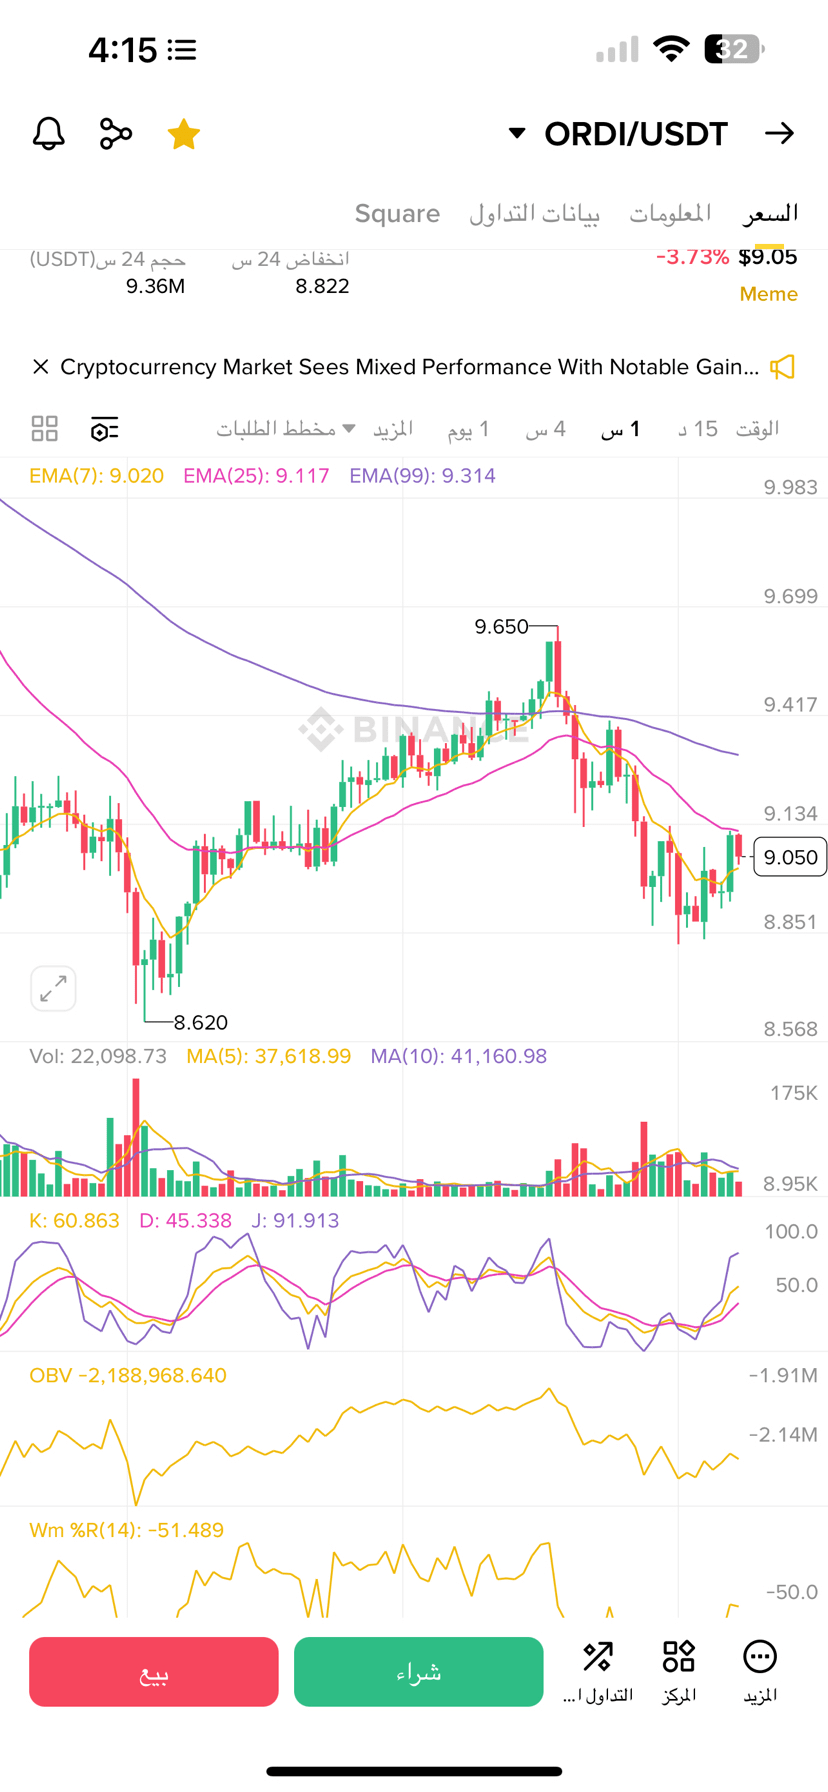
- The price is currently trading at 9.05 USDT after a drop from a nearby peak at 9.65 USDT.
- There is major support at 8.62 USDT (previous low), while the nearest resistance appears in the range of 9.30 – 9.65 USDT.
---
Moving Averages (EMA):
- EMA7 = 9.02 (in yellow)
- EMA25 = 9.11 (in pink)
- EMA99 = 9.31 (in purple)
We observe that the price is currently below the EMA99 level, indicating a continuation of the downward trend in the short term.
However, the price is approaching EMA7 and EMA25 levels, which may indicate a potential short-term rebound.
---
Technical Indicators:
1. Stochastic Indicator (KDJ):
- K = 60, D = 45, J = 91
- Indicates the beginning of exiting the oversold area, but it is nearing the overbought zone (at 90), which may slow the rise soon.
2. OBV (On Balance Volume):
- Still in a downward path, indicating that the outflowing liquidity exceeds the incoming, weakening the current rebound strength.
3. Williams %R (14):
- Current value = -51, placing the price in a neutral zone that is neither a sell nor a buy.
---
Support and resistance levels:
- Support: 8.85 – 8.62
- Resistance: 9.30 – 9.65
---
Technical Summary:
- The overall trend remains bearish in the short term due to the price staying under EMA99.
- There is a short-term corrective rebound (from 8.62 to 9.05 currently).
- If the price surpasses 9.30 with a strong close and high trading volume, it may target 9.65 again.
- If it fails and breaks the support level 8.85 then 8.62, the decline may continue to lower levels.
Proposed trading strategy:
- For short-term traders: Watch for a breakout at 9.30 to buy with a target of 9.60.
- For conservative investors: Wait for a close above EMA99 (9.31) to confirm a trend change.