
As the cycle nears its end, the noise often narrows down to two names: Bitcoin, the long-favored coin, and XRP, the coin that keeps bouncing back. Those wondering if it's too late to buy in are really questioning which coin still has better trading opportunities. The chart between these two coins will provide a clearer answer than just looking at their dollar prices.
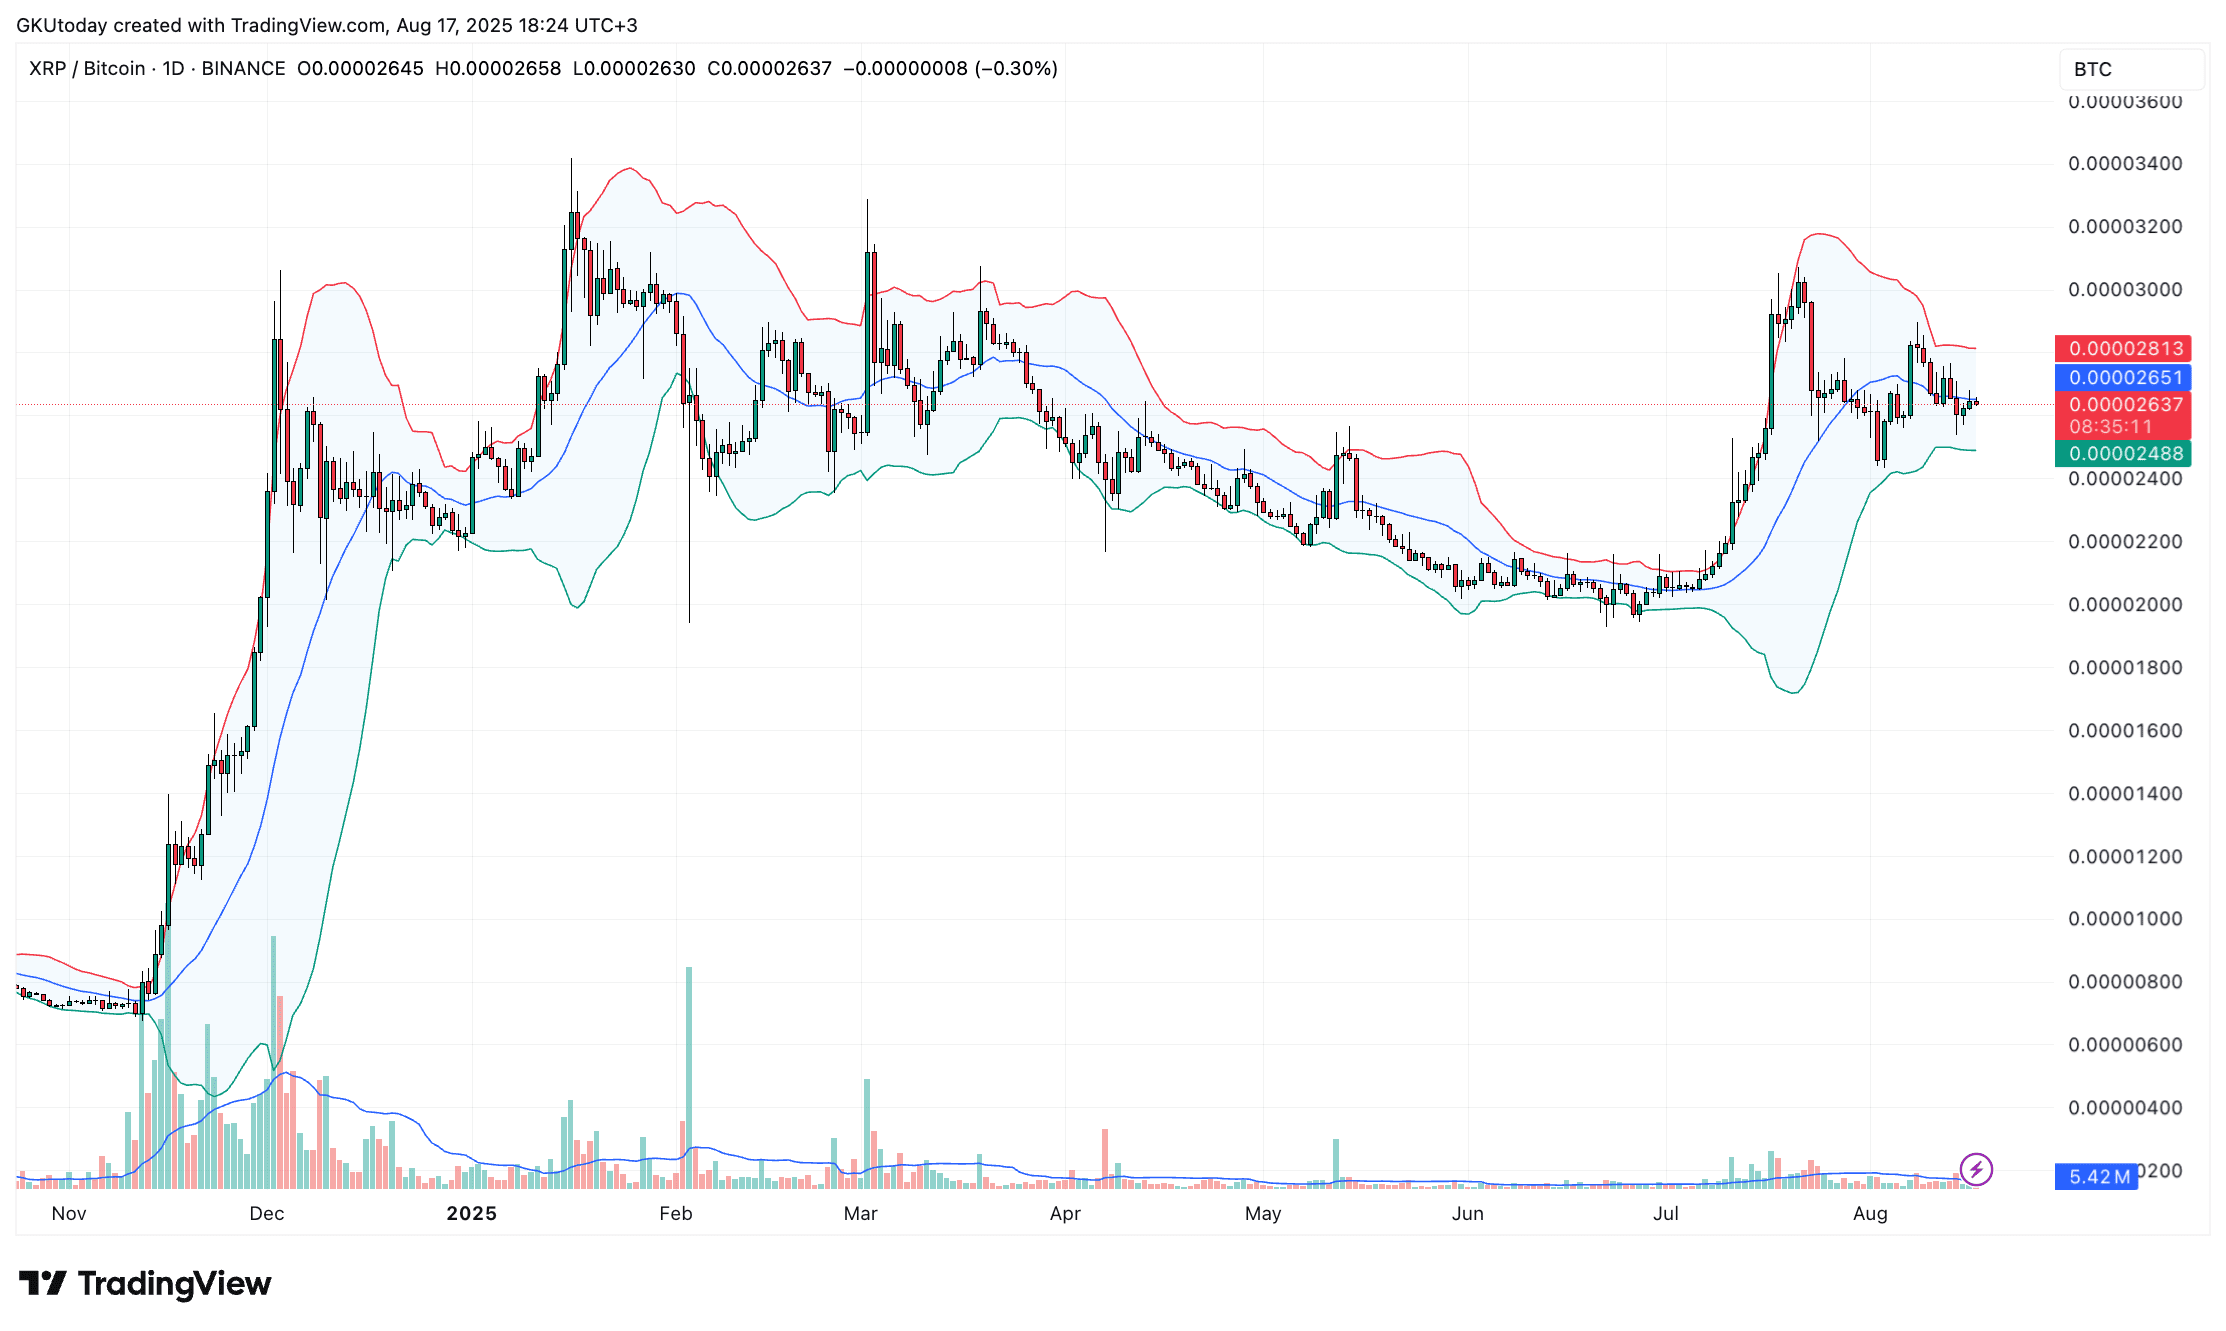
On the XRP/BTC pair, the Bollinger bands — those simple yet highly indicative lines that have made their mark in the financial market — are gradually closing. Such conditions typically do not last.
The last time this happened, at the end of last year, XRP surged against Bitcoin, doubling in value before retracing. Currently, it seems that XRP is hovering around 0.000026 BTC. This is a setup that often leads to quick decisions.
Take a step back and look at the weekly picture. For most of the past five years, Bitcoin has maintained its leading position, while XRP has declined or moved sideways.
Two Coins, One FOMO
The major resistance level at 0.000055 BTC has not been hit since 2018, but the price surge of XRP earlier this year — from below 0.000010 BTC to around 0.000020 BTC — suggests that this coin still has the potential to break out when the market opens. That's why XRP attracts those looking for percentage profits, even in the late stage of the cycle.
This choice is simple in form, but more difficult to execute. Bitcoin may not be as attractive, but it is perhaps the safer choice for holding at the late stage. XRP is riskier, but also has the potential for a strong price increase if selling pressure continues to rise. These bands will not remain tightly maintained for long, and once they expand, one of these coins will show which side of the trade is worth FOMO.

