Ethereum is about to enter a new week, following an exciting price volatility week, witnessing this cryptocurrency trading at its highest price since 2021. On one hand, spot Ethereum ETFs, which have attracted billions of dollars in investment capital, have just recorded their first daily outflow after more than a week. On the other hand, order book data indicates a massive sell wall at $4,800, which can be described as Ethereum's 'final boss', a level that could trigger a parabolic rally if breached.
ETF Capital Outflows Sharply: Is the Sentiment Cooling Down?
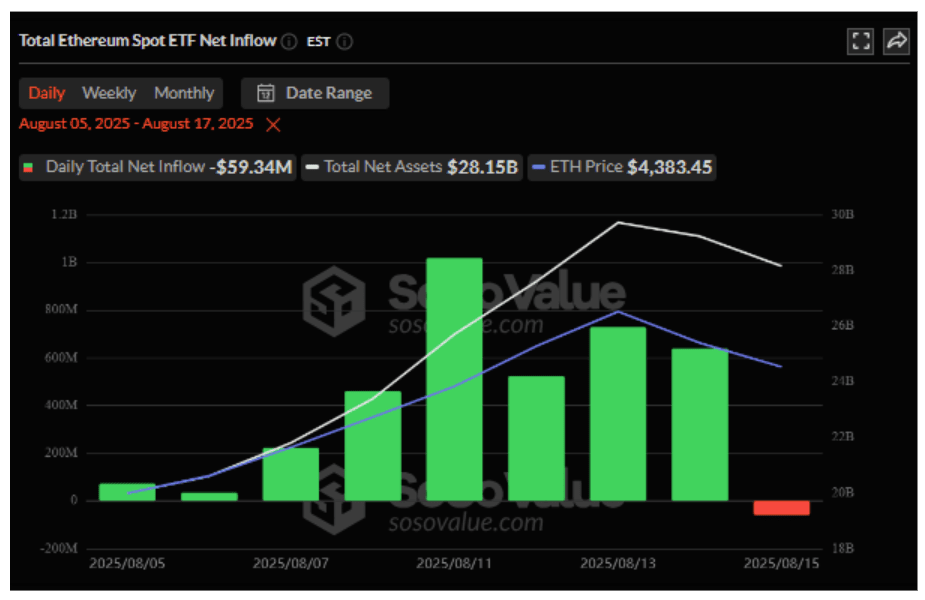
Optimism about Ethereum's bullish momentum cooled off as this week came to a close. Notably, US spot ETH ETFs reported a net inflow of $59.34 million on August 15, ending an eight-day streak that added $3.7 billion in inflows.
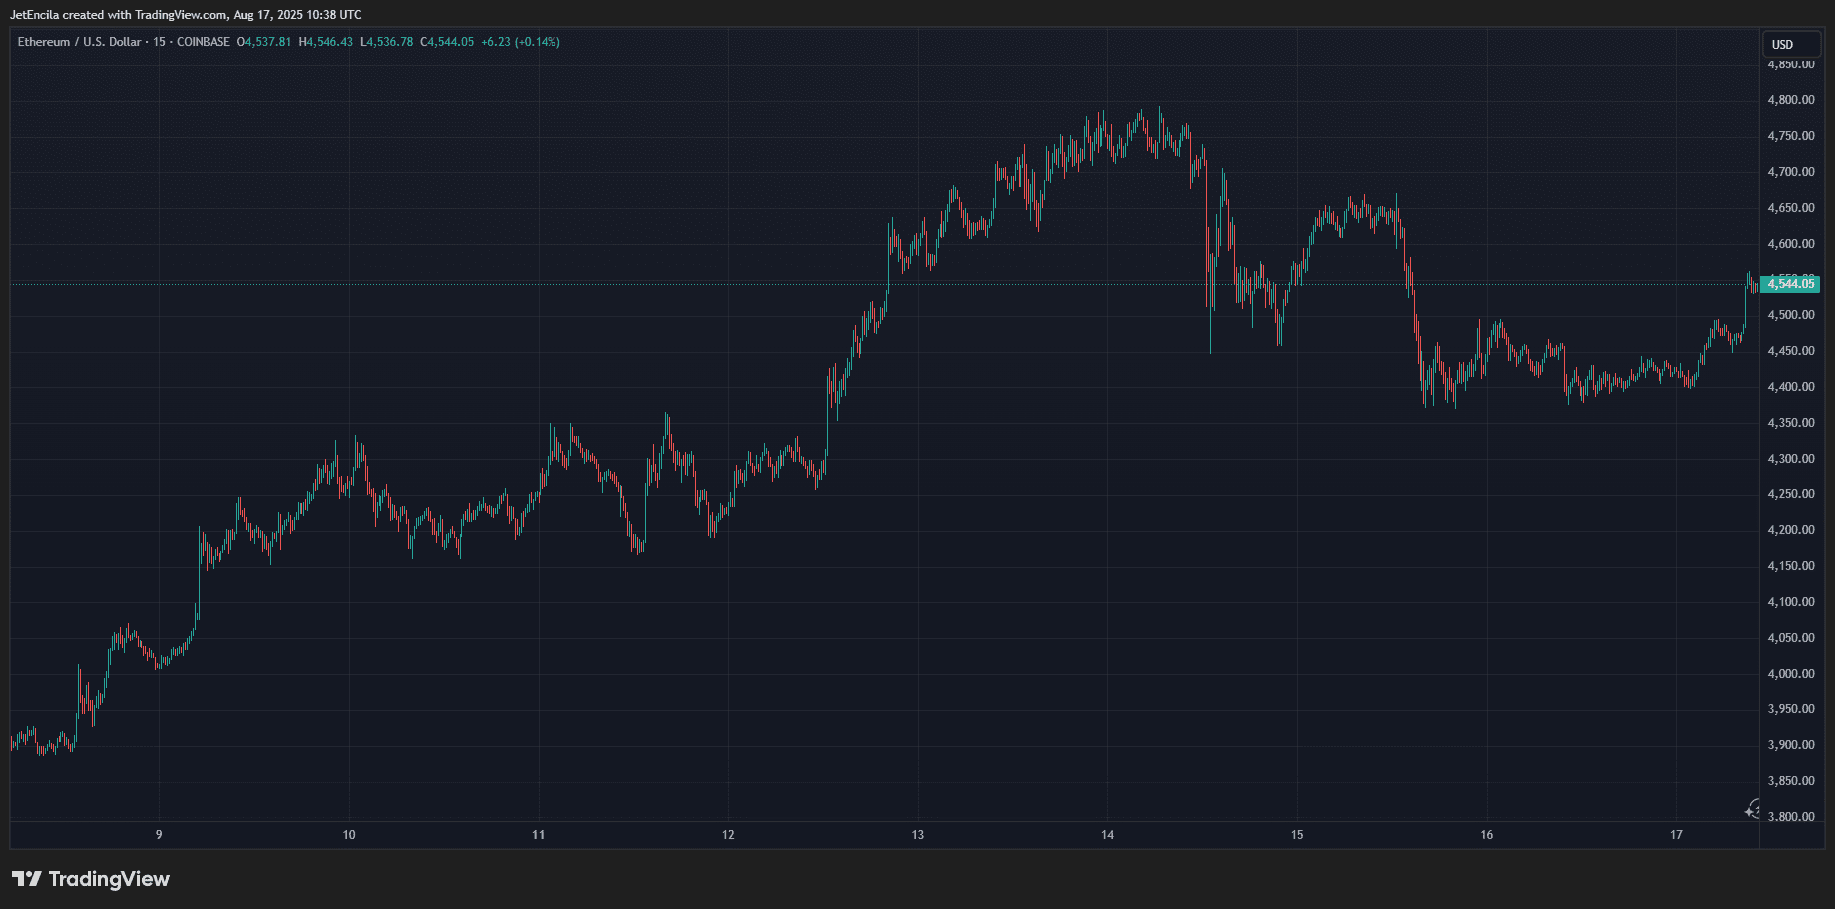
The reversal occurred just as Ethereum failed to break through the $4,788 mark, only about 3% away from the all-time high of $4,878, before dropping back to around $4,450. While BlackRock's ETHA stands out with $338.09 million in daily inflows, Grayscale's ETHE and Fidelity's FETH recorded significant outflows of $101.74 million and $272.23 million, respectively.
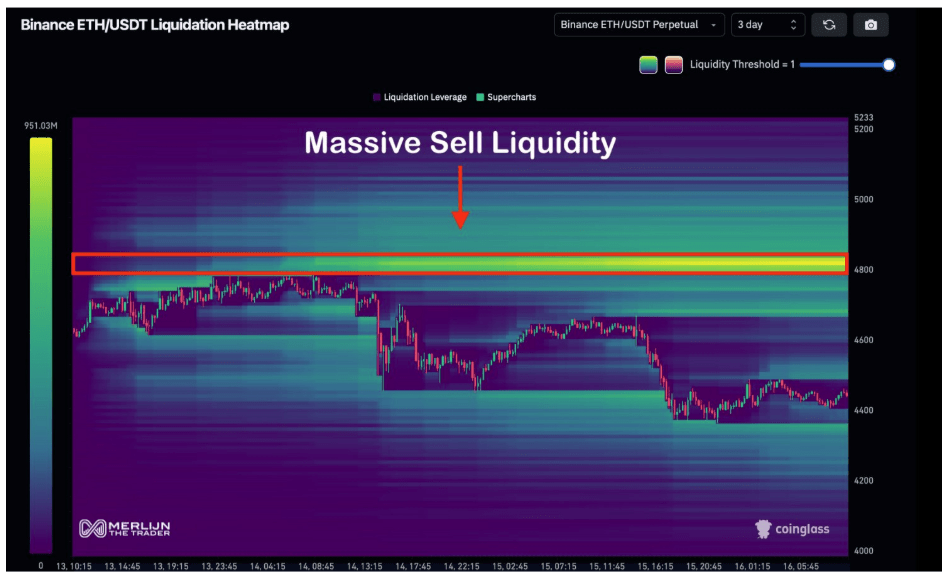
Speaking of Ethereum's inability to surpass the $4,788 mark, on-chain data shows a massive liquidity pool around this level. Specifically, Merlijn The Trader described the $4,800 level as Ethereum's 'final boss', indicating billions of sell orders stacked up at that level on Binance's ETH/USDT pair.
The liquidity heat map shows a large concentration of buy orders in this area. According to the analyst, breaking through this threshold could open up a wide sky for Ethereum. As long as this threshold is filled with more buy orders, it is likely to serve as resistance for any bullish moves.
However, overcoming this fortress with sufficient buying volume will not only be a technical breakthrough but also a psychological one, with the potential to push prices to a new all-time high.
Bearish Pullback Scenario
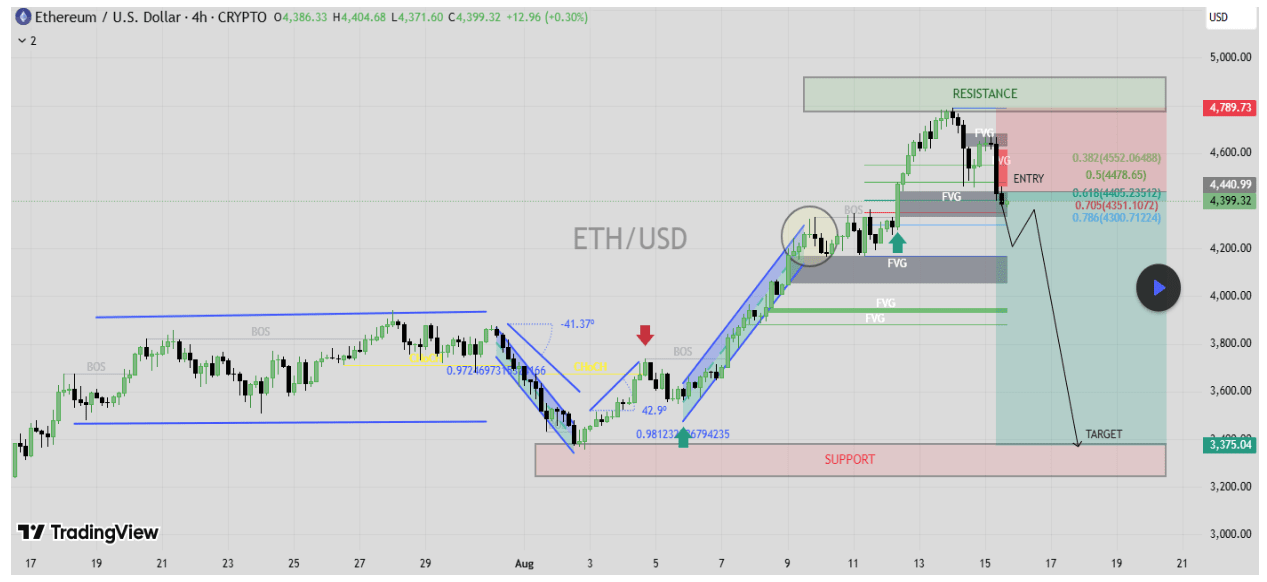
Although the current liquidity dynamics are leaning towards a bullish breakout rather than a bearish one, another analysis from TradingView shows a more cautious outlook. This analysis, based on the 4-hour candlestick chart, also identifies the $4,700 to $4,800 range as a strong resistance level, where Ethereum has shown signs of supply exhaustion after a strong bullish rally since early August.
However, many technical signals, such as the Structure Break signal, Fair Value Gap (FVG), and Fibonacci retracement levels, suggest that Ethereum may be due for a pullback. The outlined trading plan predicts prices will enter the $4,440 range, with a stop loss above $4,790 and a bearish target of $3,375 at a strong support area. This implies a correction of over 20% if the bearish forecast is accurate.