If you've been wondering if the price of Ethereum is crazy or not, the famous rainbow chart has the answer for August 31. 🌈💰
My people! Ethereum has taken a hit, but a super colorful chart is giving hints of what could happen at the end of August. The famous Ethereum Rainbow Chart, which is not a horoscope, but a model that uses math to see if the coin is cheap or super expensive, gives us a perspective.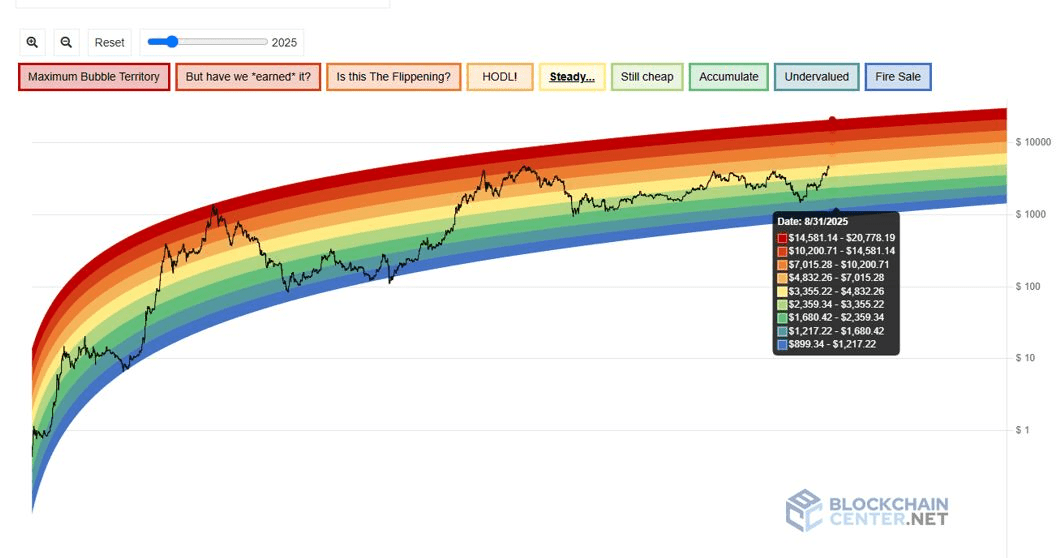
Be careful, the chart won't tell you if it goes up or down tomorrow. What it does is divide the price into color zones, from the super bargain (dark blue) to the total bubble (intense red). Imagine a traffic light but with more colors. 🚥
Right now, with Ethereum hovering around $4,400, the chart places it in the 'Stable' zone. That means, according to history, the price is exactly where it should be, neither too high nor too low. If it stays around there until August 31, the price could be between $3,355 and $4,832.
But if the bulls (those who buy) take over the market, it could enter the 'HODL!' zone (hold, for those who don't know) between $4,832 and $7,015. And if things get super crazy, we could reach the 'Maximum Bubble Territory' which goes over $20,000. 🤯
So, although it has dropped a bit, the long-term trend is strong and technical indicators confirm that there is good upward momentum. Stay alert!
What do you think? Will it stay in the stable zone, or will we see ETH rise before the end of the month? 🤔$ETH
