On July 31, $SUI lost the support of $3.68, activating a deeper correction scenario, projecting a drop of up to 30%, with a direct target in the region of approximately $2.57, where there is strong liquidity accumulation. #SUİ #btc
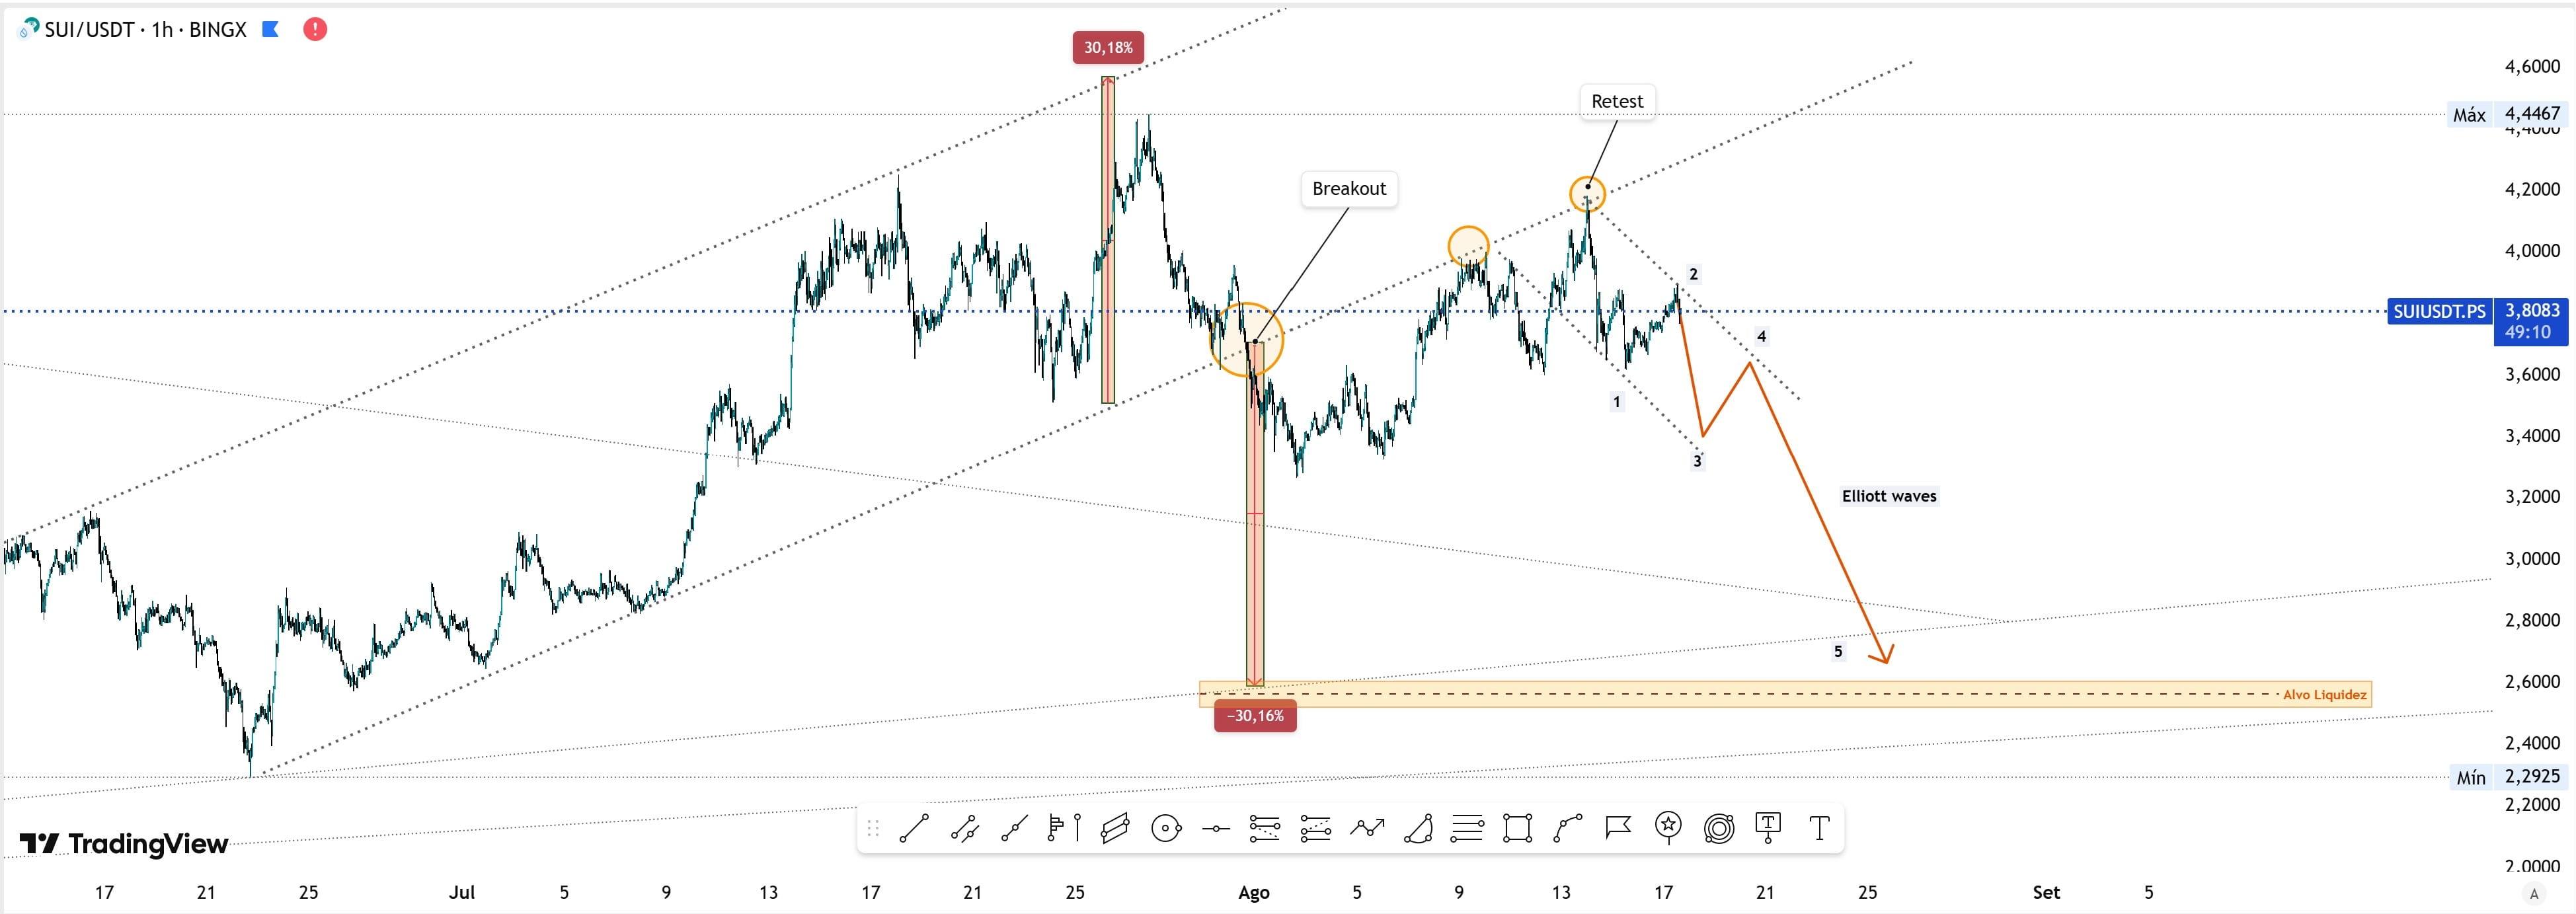
After the breakdown of support, the first drop took the price down to $3.59. Then, there was a temporary recovery that pushed SUI up to $4.18, configuring only a retest below the broken channel. Selling pressure returned to dominate, and the asset formed a new low at $3.31, before making another upward correction, reaching $3.87, a region that coincides with the 0.5 Fibonacci retracement of the corrective wave.
This behavior reinforces the classic scenario of Elliott Waves, where SUI would have already completed the initial phases and would be entering the 3rd wave of decline — usually the strongest and most extensive. If confirmed, this movement could accelerate the drop towards the target at $2.57.
The risk of further declines remains high, especially since Bitcoin, after marking a new all-time high, has already begun to lose important supports and could correct down to $115,000 in search of liquidity before attempting to resume the upward trend.
In the short term, SUI maintains a downward trend, and the market continues to aim for liquidity collection at $2.57, which may finally serve as solid support for a future recovery.
Elliott waves on SUI (with points 4.18 → 3.31 → 3.87 → target 2.57)