$BTC The daily chart of Bitcoin shows a strong upward trend, peaking at $124,517, followed by a sharp pullback that pushed the price to consolidation levels around $118,000.
Current support levels between $117,000 and $118,000 remain stable, however, the volume has decreased, indicating a weakening confidence among buyers.
If the price breaks above $119,000 with higher volume, a rise to $121,000–$122,500 is possible, while a break below $116,500 may confirm a bearish reversal.
This level remains critical to watch, considering a potential double top forming at the recent highs.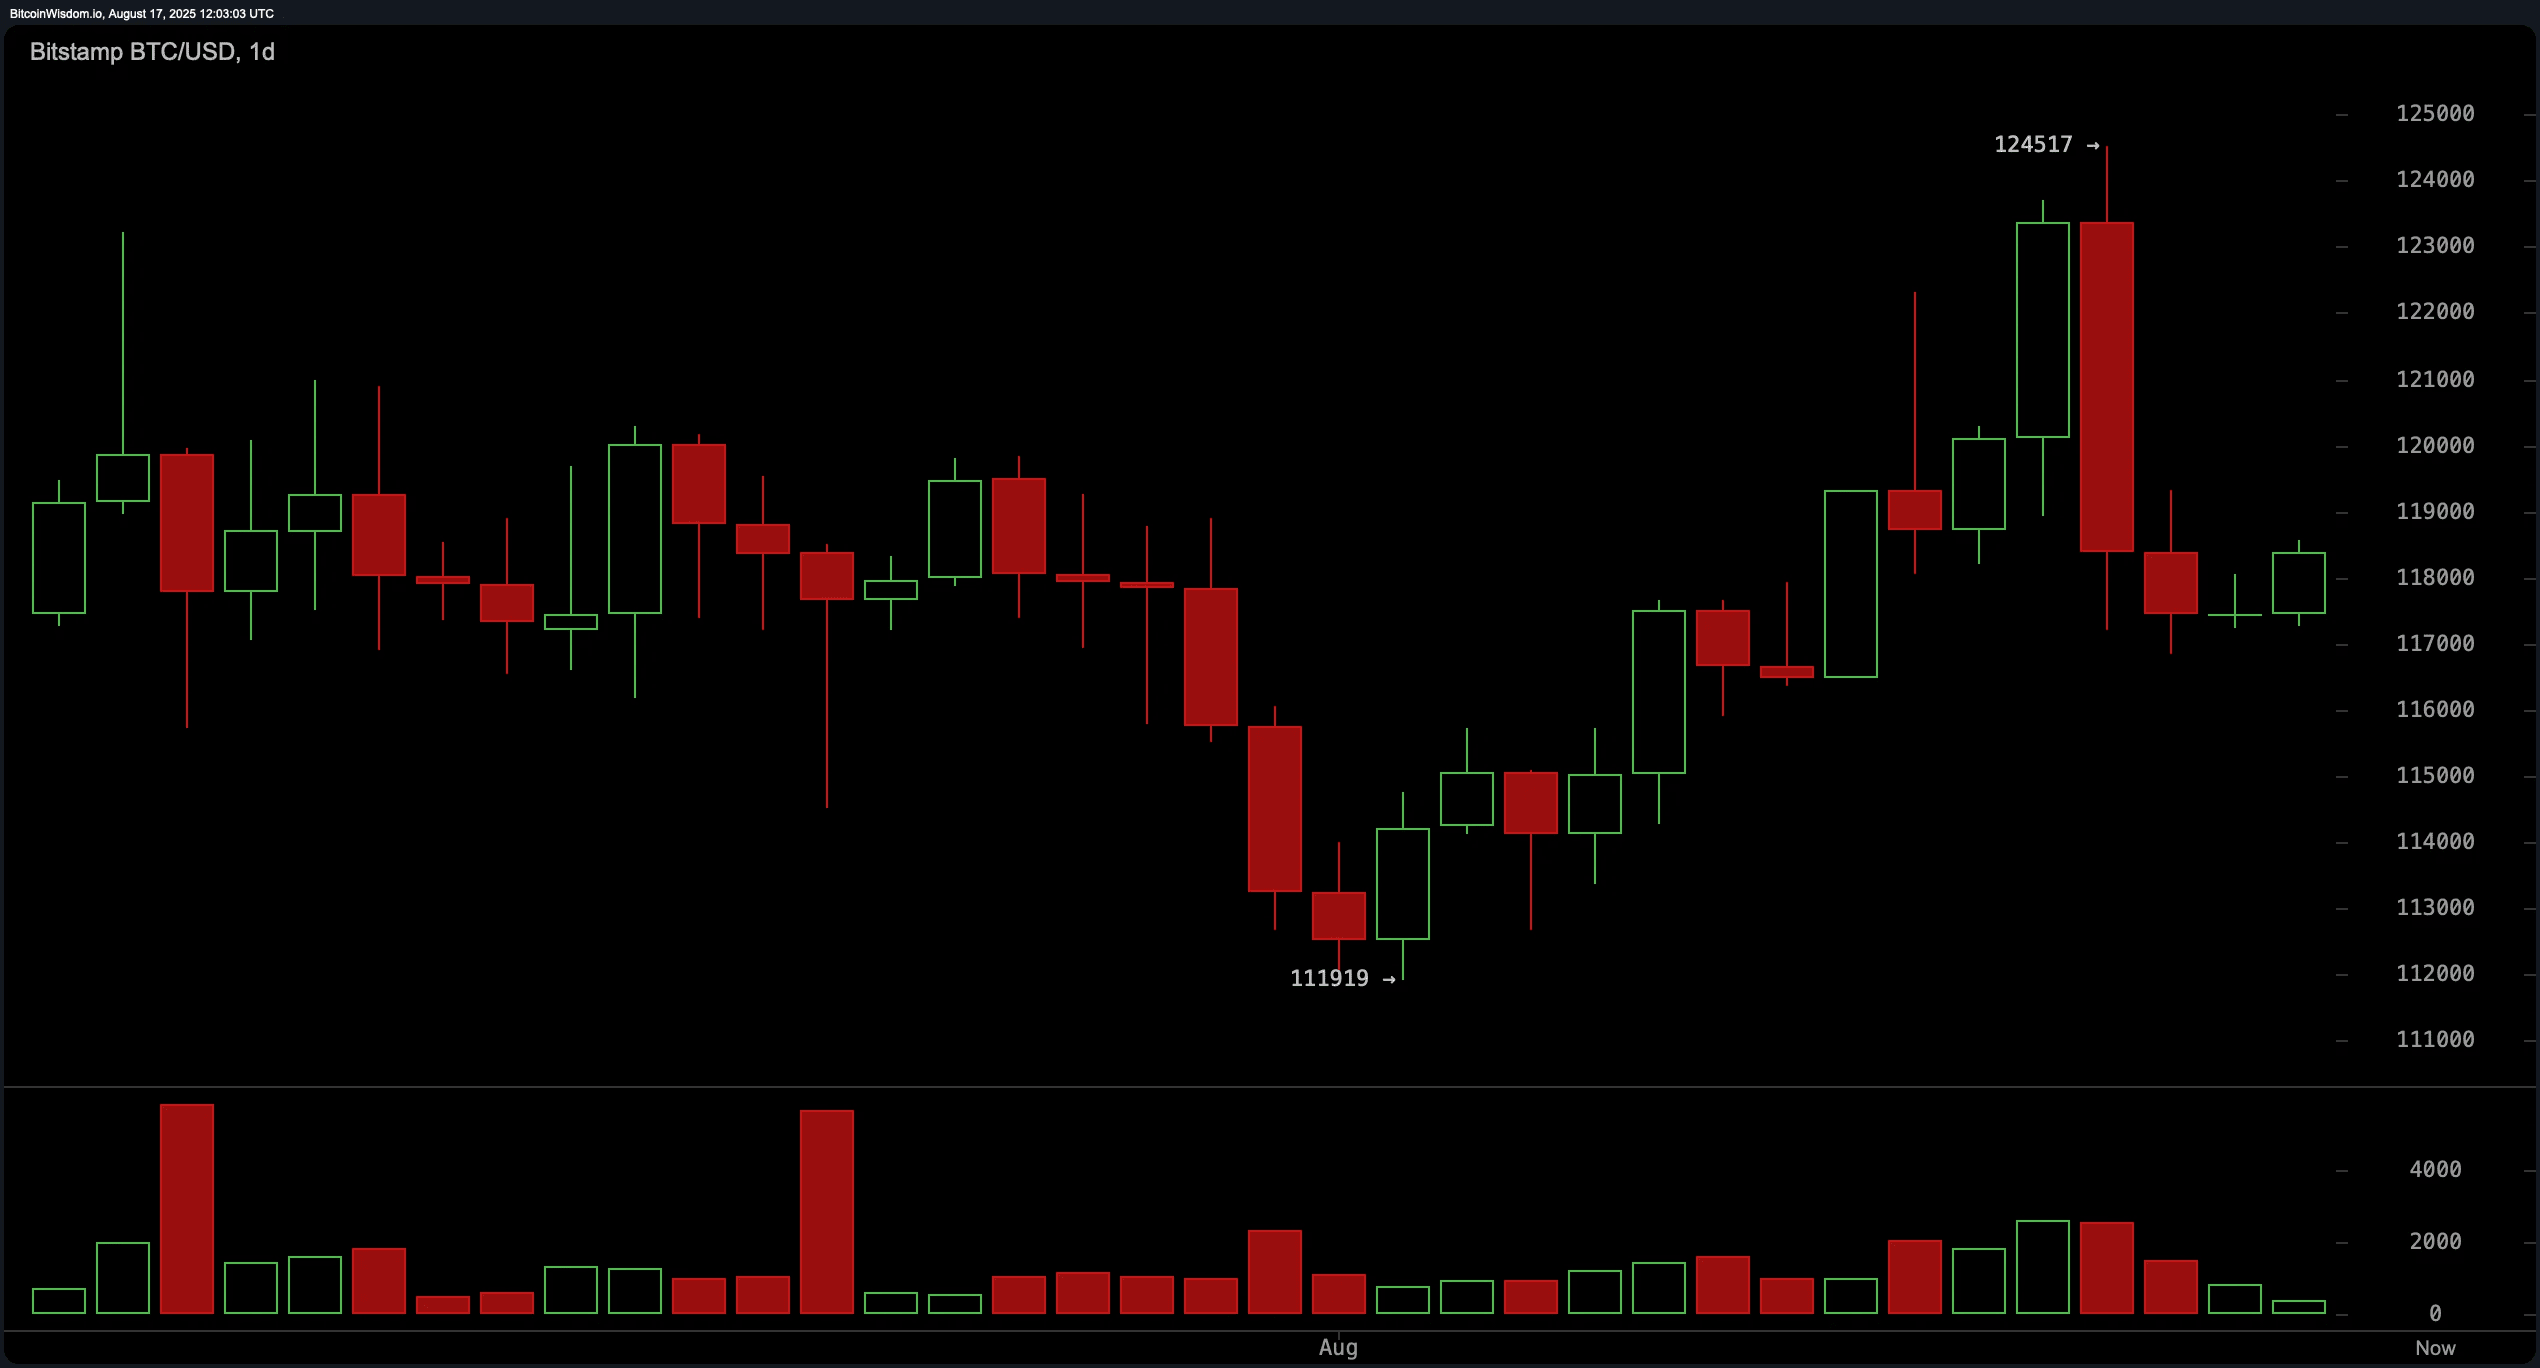
=========
On the four-hour chart, Bitcoin is recovering from a temporary low at $116,856, showing the first signs of base formation.
Despite large red candles from the local high, higher lows are forming, providing some stability.
The price fluctuates below $119,000, but buying momentum remains weak.
A break above $119,500 with a confirmed bullish candle could pave the way to $121,000 or higher, while the inability to hold above $118,000 threatens further decline to $117,000.
This timeframe captures the struggle between cautious bulls and opportunistic bears.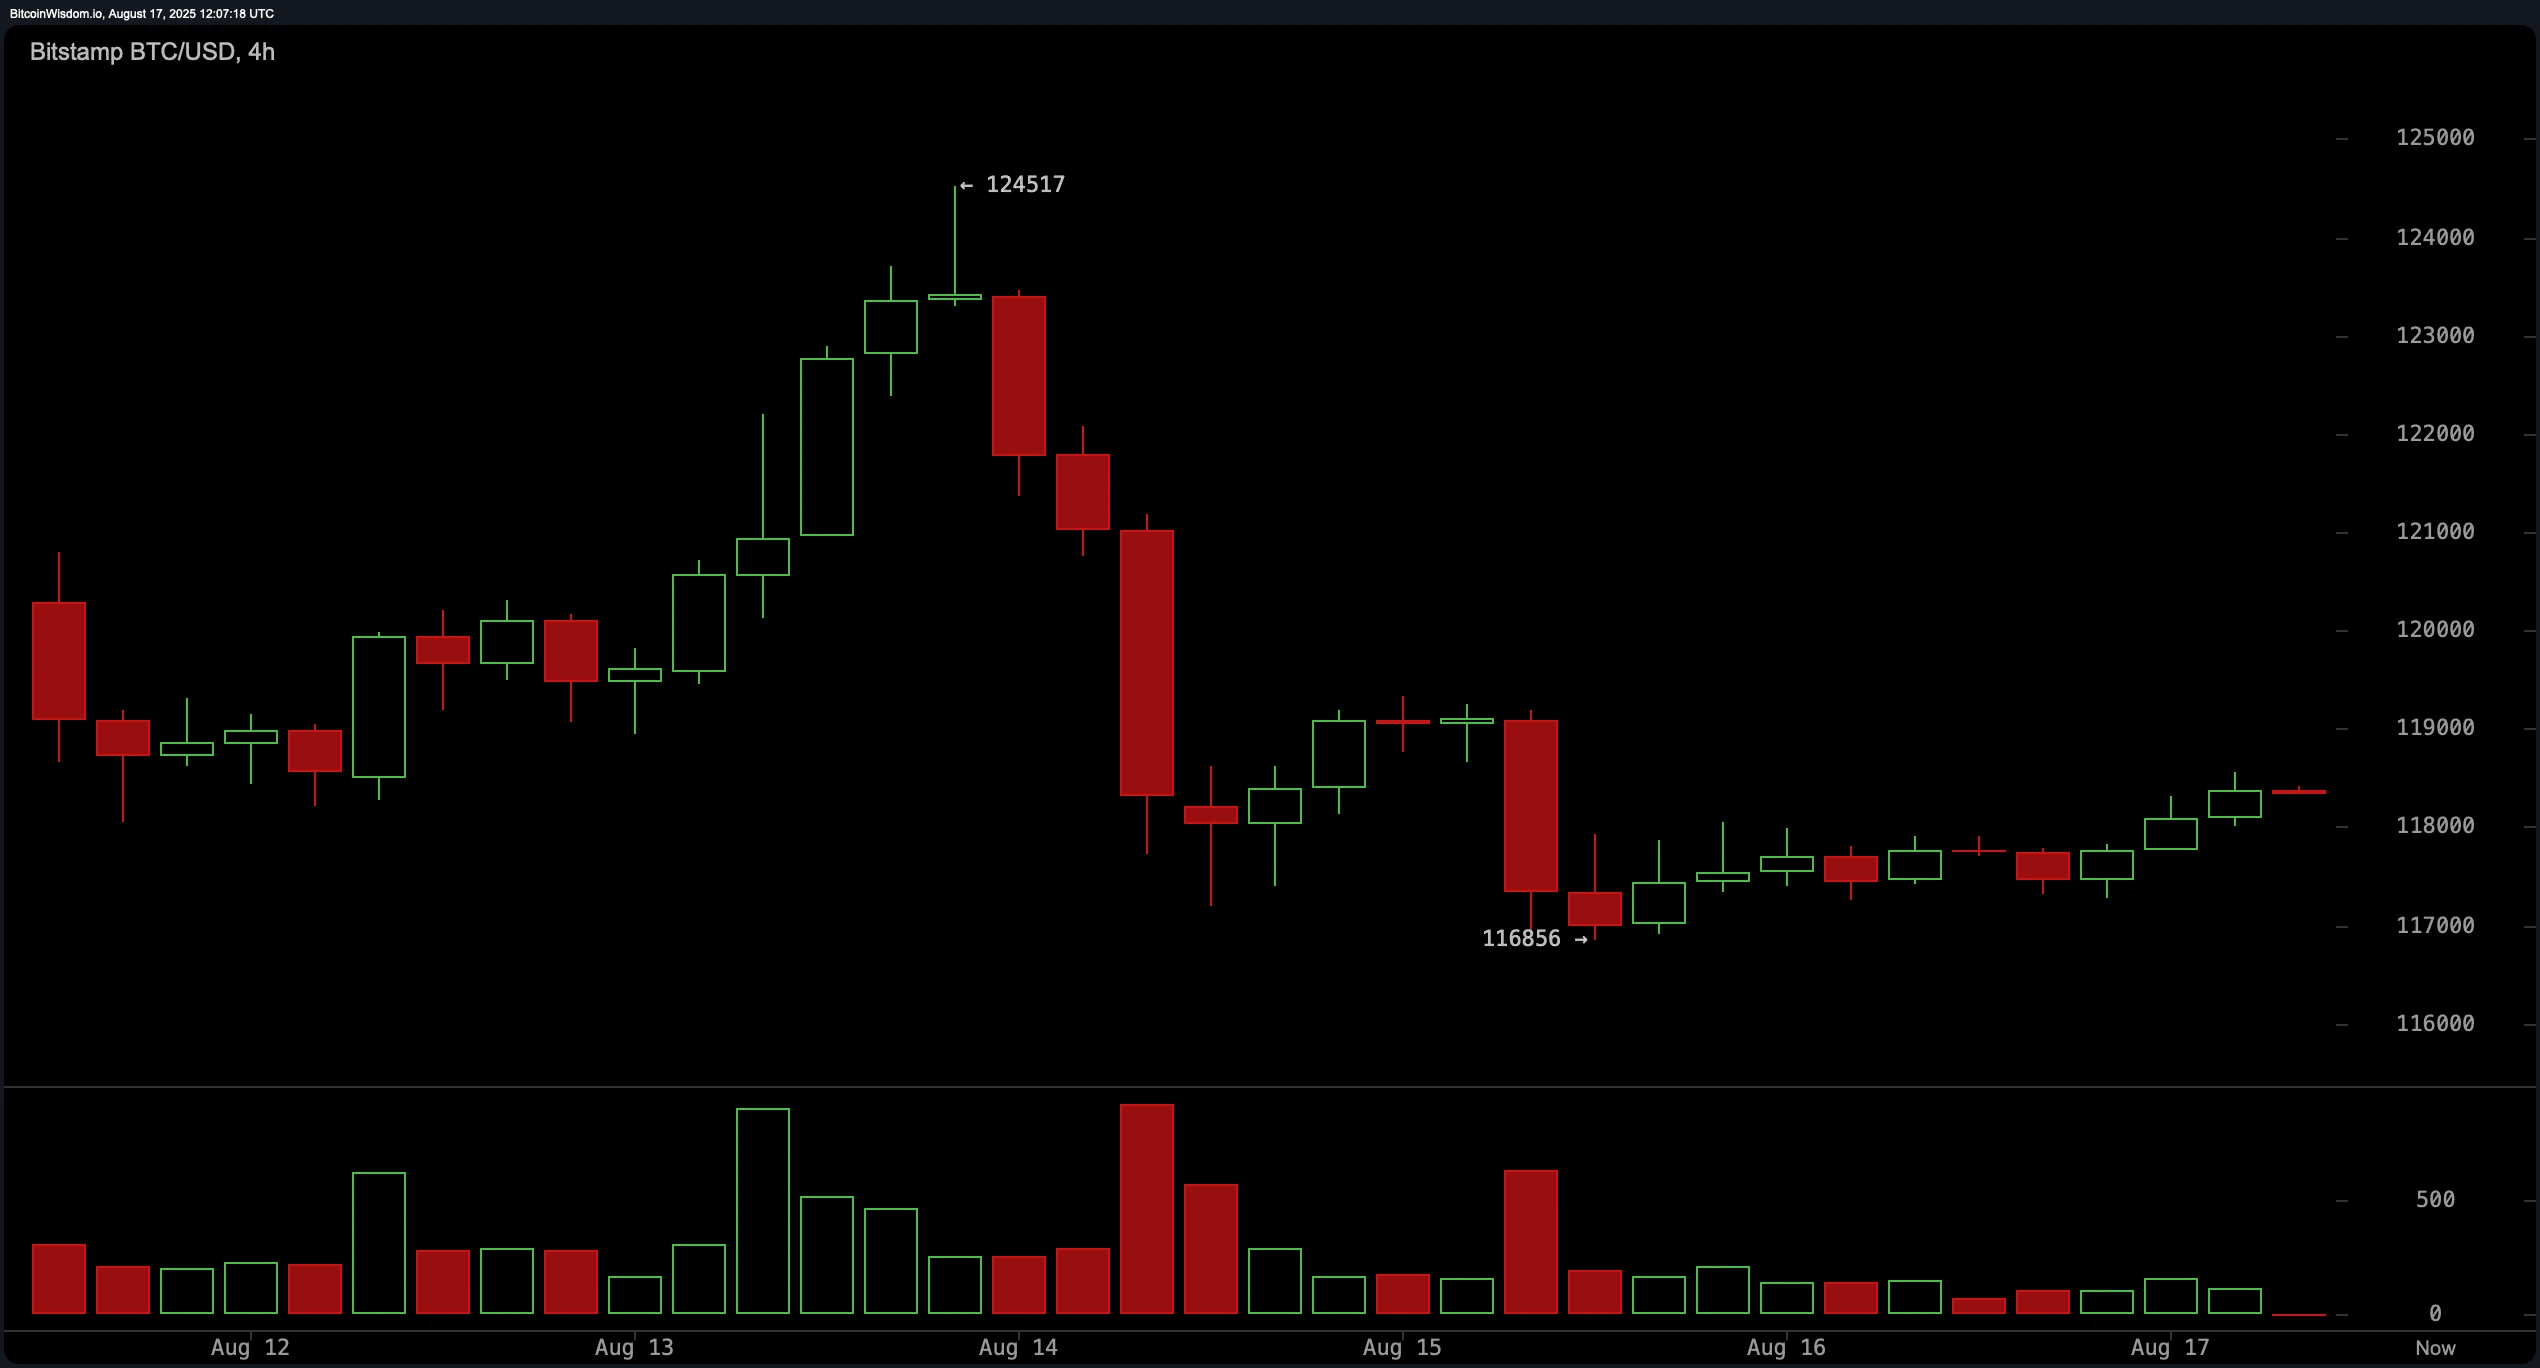
============
The hourly chart of Bitcoin shows short-term indecision as Bitcoin fluctuates between $117,800 and $118,600.
The recovery from $117,252 to $118,554 has been followed by unstable sideways movement, reflecting low momentum.
Volume has decreased, increasing the likelihood of a sharp spike in volatility.
Traders are awaiting a decisive breakout:
A rise above $118,600 may target $119,500, while a break below $117,800 could trigger a drop to $116,500.
This intraday range suggests potential scalping opportunities but requires strict risk management.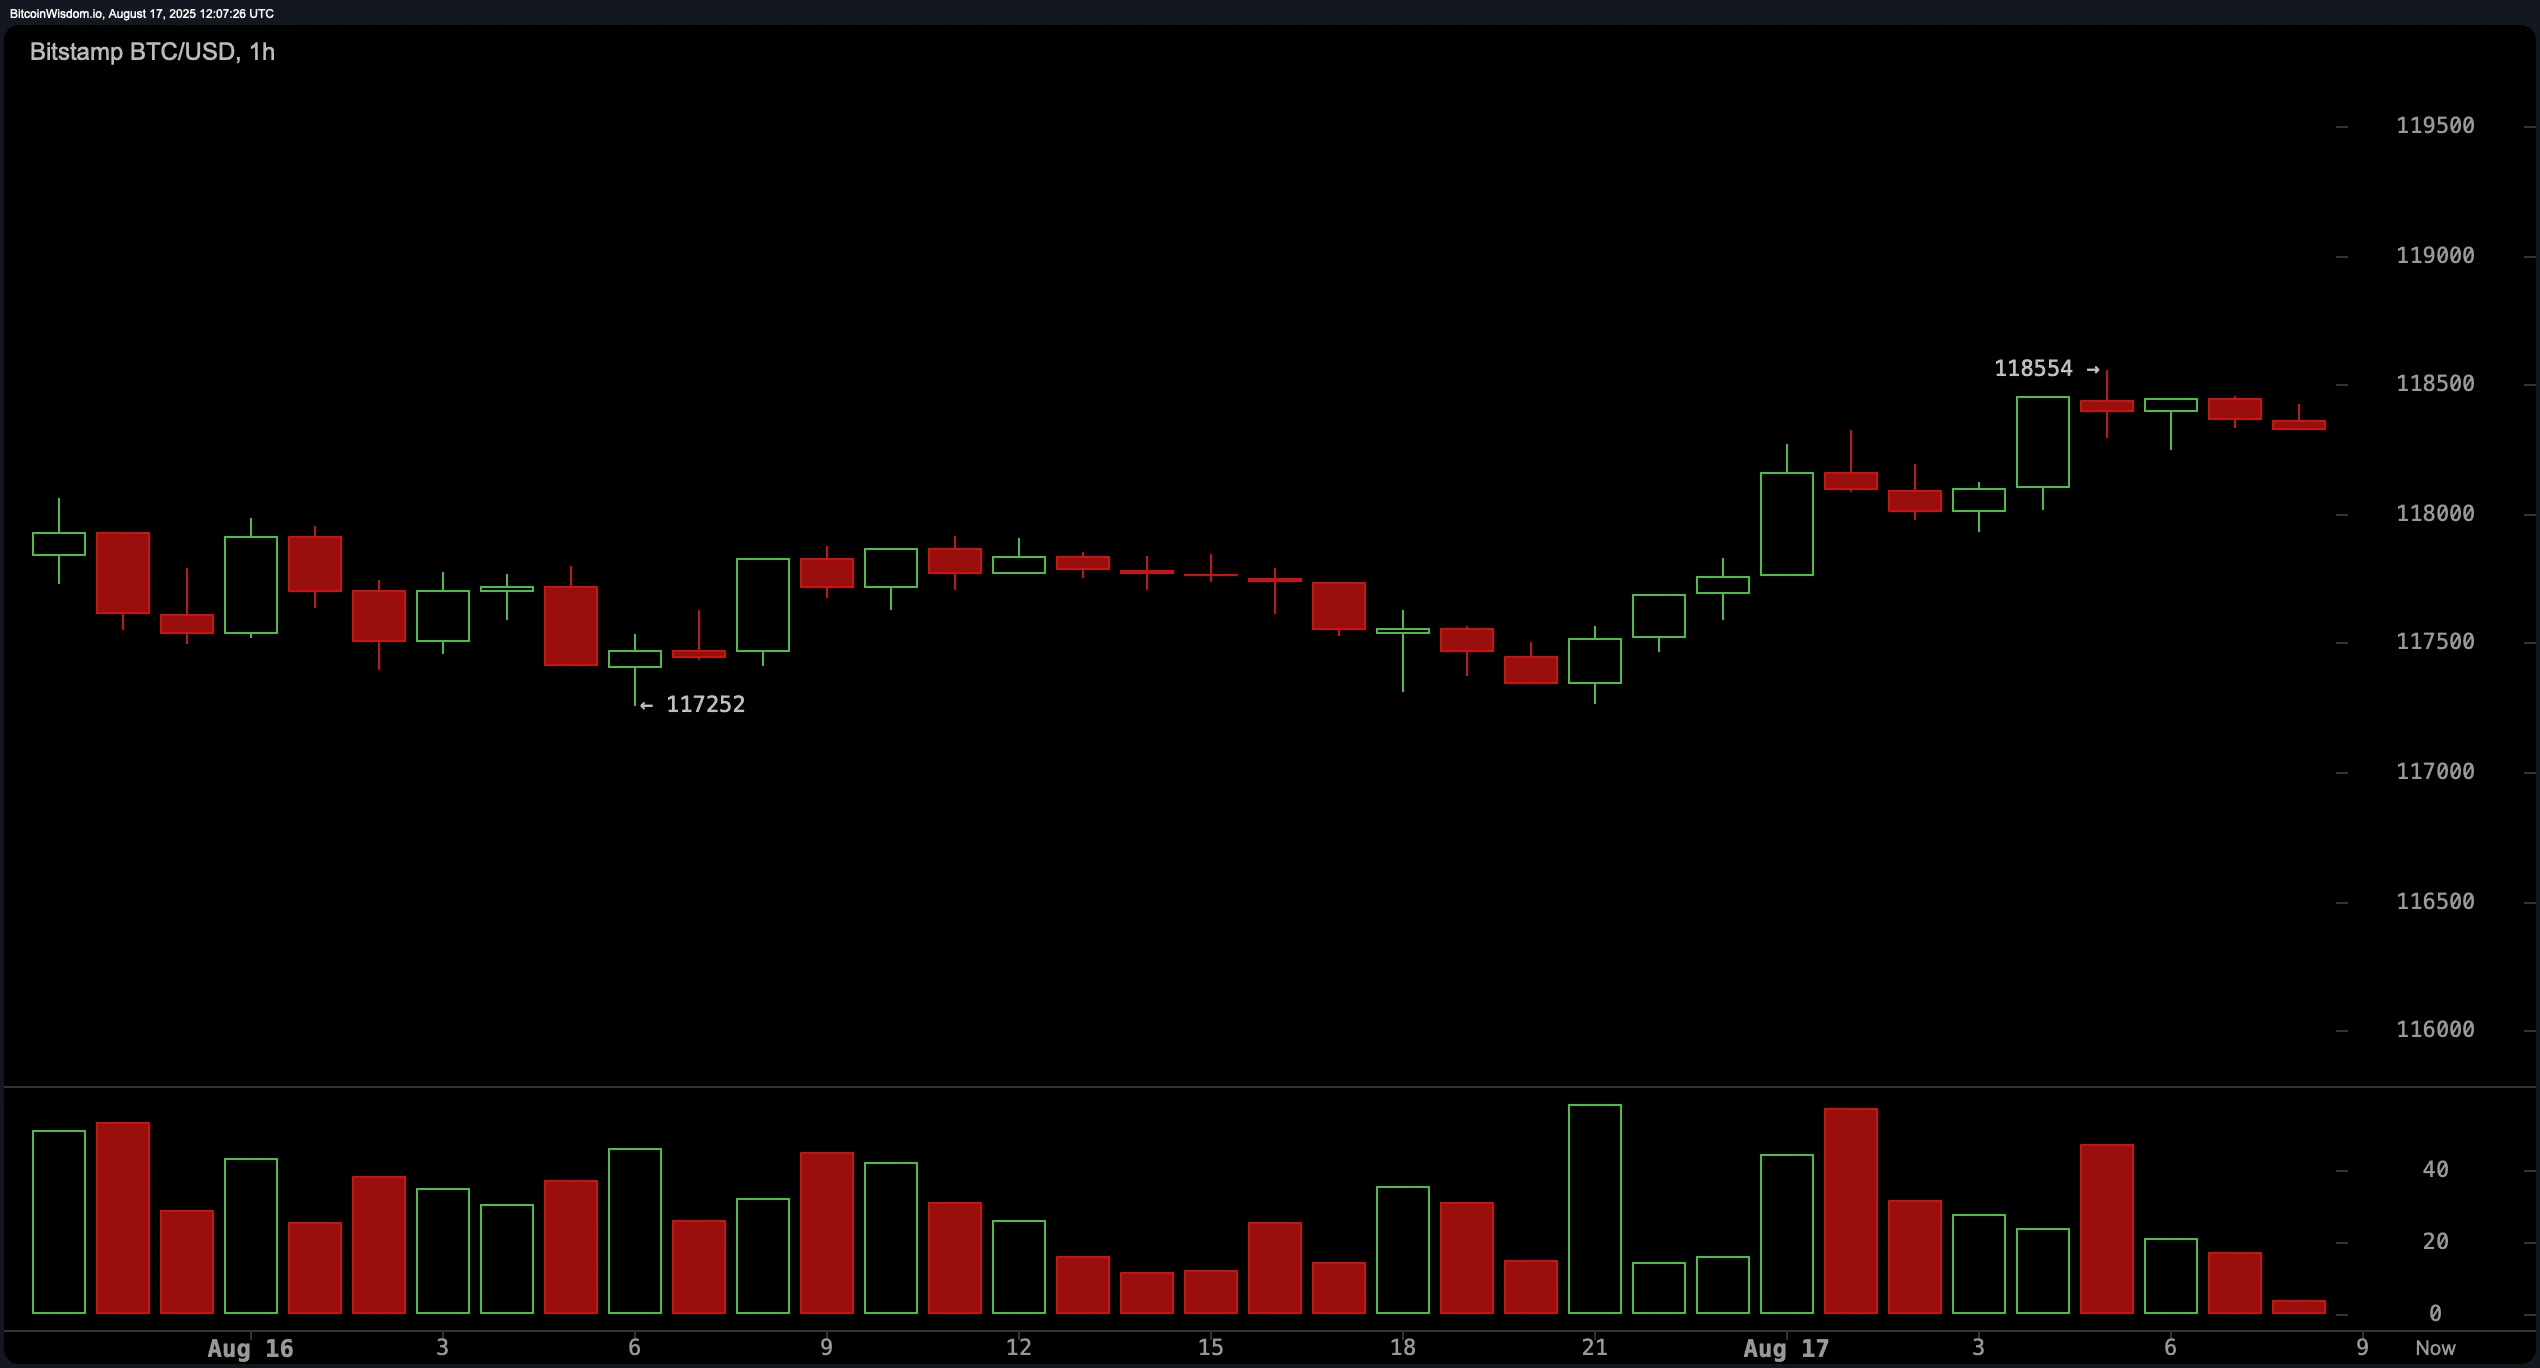
===========
Bullish Verdict:
If Bitcoin maintains support above $117,500 and breaks resistance in the $119,000–$119,500 range with volume, the path will open to levels of $121,000–$122,500 in the near term.
Strong buy signals from long-term moving averages strengthen the broader upward trend, suggesting that the current consolidation may serve as a springboard for the next growth phase.
===========
Bearish Verdict:
The inability to hold the $117,000 level and a break below $116,500 is likely to confirm a bearish continuation, opening targets lower to $114,615 and possibly down to a minimum of $111,919.
Weak oscillator conditions and sell signals from momentum and moving average convergence/divergence (MACD) highlight the risk that bulls may struggle to defend current levels.

