

Analyst Ali identifies $3.17 as crucial support, with a failure potentially exposing deeper levels at $2.88 and $2.61.
RSI at 52.43 shows market neutrality, leaning bullish while above 50, with rallies likely above 60 and declines below 40.
MACD shows mild bearish crossover, yet momentum stays constructive, with targets at $5.40, $6.01, and $7.15 if $4.33 clears.
SUI’s recent trading activity has brought its long term trend into sharp focus, as technical indicators show both support and resistance challenges. The crypto has repeatedly struggled to push above the $4.00 level, with multiple rejections suggesting sellers are defending the region.
According to analyst Ali, the asset inability to break past $4.00 again leaves $3.17 as the immediate support to watch. Price behavior shows signs of consolidation, indicating a balanced market structure, yet maintaining a bullish undertone as long as critical supports hold.
Support and Resistance Levels
The ascending trendline beginning in April is key in maintaining upward momentum. Fibonacci retracement levels show $3.1735 as a major support, aligning with the 0.618 level. If this zone fails, price could slide toward $2.88 or even $2.61.
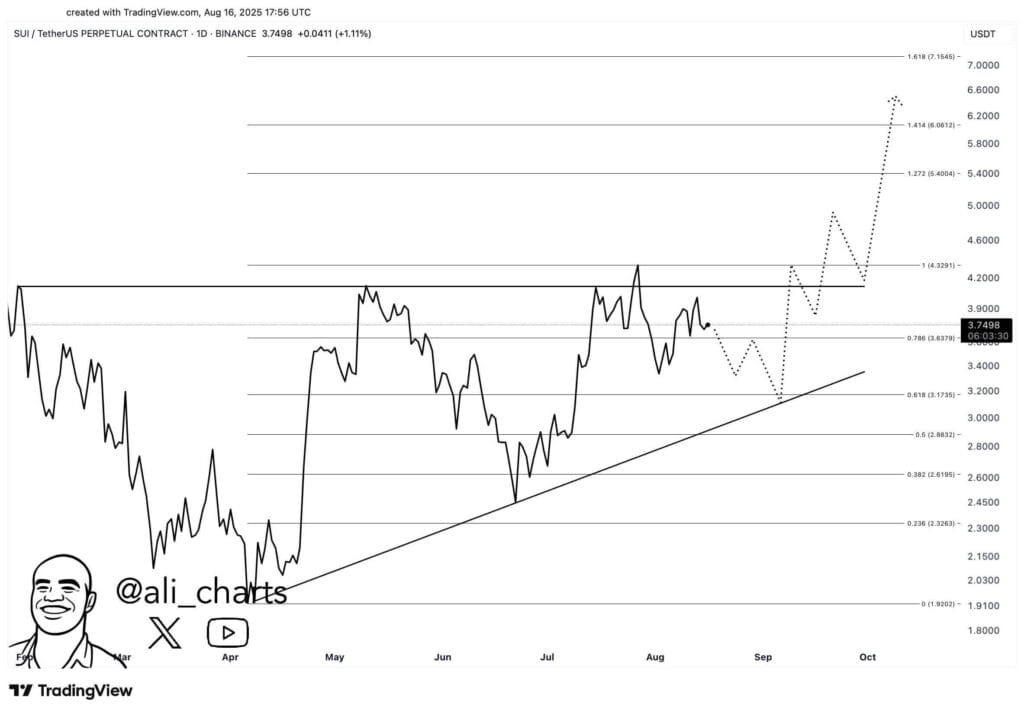 SUI/USDT Perpetual Contract 1-day price chart, Source: Ali on X
On the upside, resistance is near $4.3291, coinciding with earlier peaks and the Fib 1.0 level. Clearing this top would likely strengthen bullish momentum and lead toward higher Fibonacci extension targets.
Technical Indicators Show Market Balance
Price is moving between $3.50 and $4.00, suggesting consolidation after a mid July rebound. Repeated rejections around $4.20 show strong selling interest at higher levels. Meanwhile, trading volume is moderate at 5.14 million, indicating neither heavy accumulation nor strong distribution.
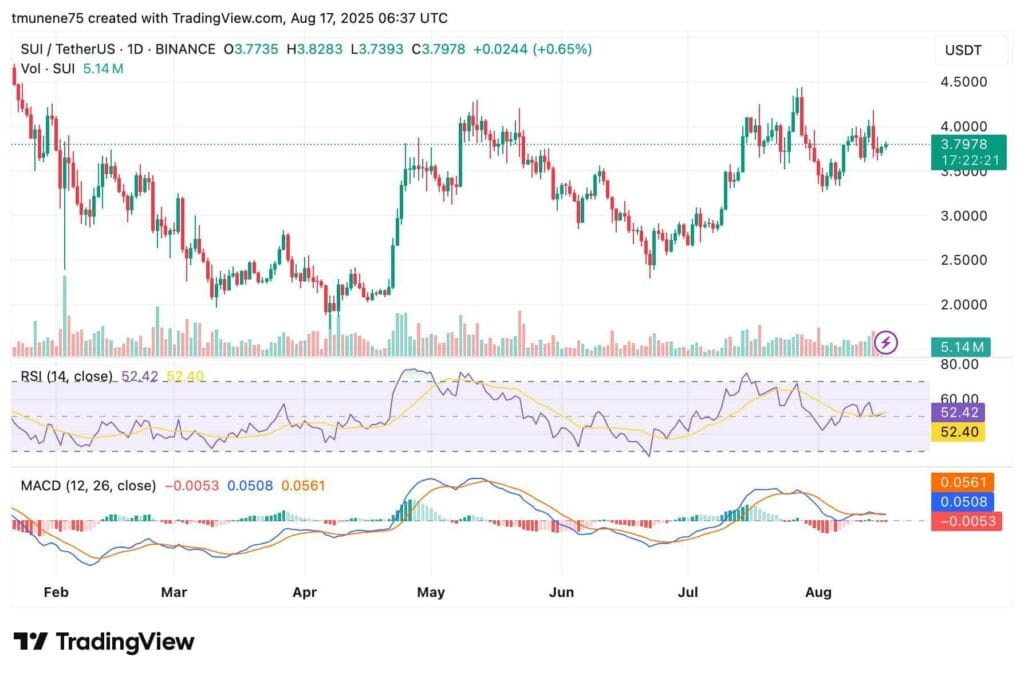 SUI/USDT 1-day price chart, Source: TradingView
The RSI is at 52.43, slightly above its moving average of 52.40. This shows neutrality, yet notably leans bullish while RSI is above the 50 line. Historical data shows rallies forming when RSI breaks 60 and declines when falling below 40.
Short Term Weakness
Momentum indicators suggest short term caution. The MACD line at 0.0508 is just below the signal line at 0.0561, producing a mild bearish crossover. However, both are in positive territory, meaning the broader trend structure is still constructive.
A short term correction toward $3.20–$3.40 is possible as part of a retest phase. Extension targets of $5.40, $6.01, and $7.15 are valid if $4.33 resistance breaks. A breakdown below the rising trendline near $3.00 would weaken this bullish outlook and potentially expose the $2.30–$2.60 zone.
The post Analyst Predicts SUI Could Drop Toward $3.17 Before Next Breakout appears on Crypto Front News. Visit our website to read more interesting articles about cryptocurrency, blockchain technology, and digital assets.

