Candlestick patterns are universal tools in the arsenal of any cryptocurrency trader. Understanding them, and the various historical chart patterns are what allows crypto traders to interpret and analyze the trend of the market and make pattern trading decisions. Which are hopefully profitable! The better and more experienced you are at technical analysis skews the odds in your favor of making the most from bullish and bearish trends. It’s highly suggested to combine candlestick patterns trading with things like trading based on trend lines for extra confluence.
Anyways, let’s get into the various types of crypto chart patterns that traders use and how to spot them with guides. Hopefully, by the end of this article, you’ll feel like a pro at spotting chart patterns.
Types of Trading Patterns
Before getting into the various types of trading patterns. Let’s first understand what a candlestick is. It’s just a single bar that shows the movement of a particular asset or crypto’s price over a certain period of time. It shows us the open, high, low, and close for our selected time frame. People typically make their trades based on 1,2, and 4 hour time frames, or candles, as well as daily, weekly, and monthly. However, all of the patterns gone over in this encyclopedia of chart patterns can be applied to lower time frames and candles such as the 1, 15, and 30 minute. Though, one must be careful on such low time frames, as the crypto market is very, very volatile.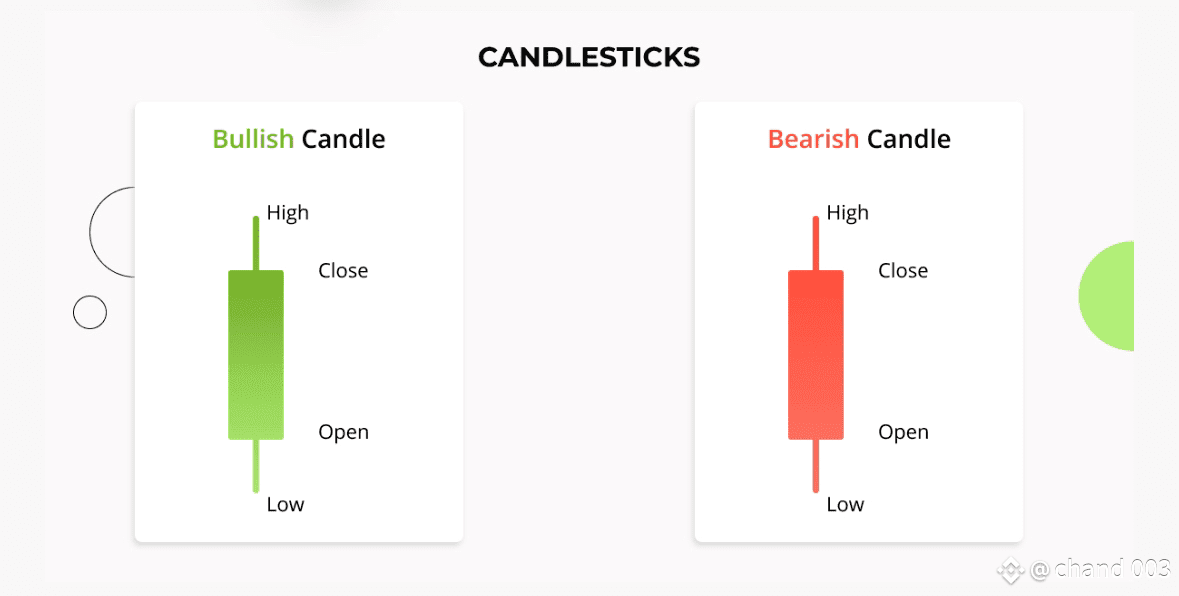
Above is an example of what candlesticks look like and what they represent. Every candle has a low price, high price, and an open and close price, represented by the wicks (or legs) and “body” of a candle, respectively.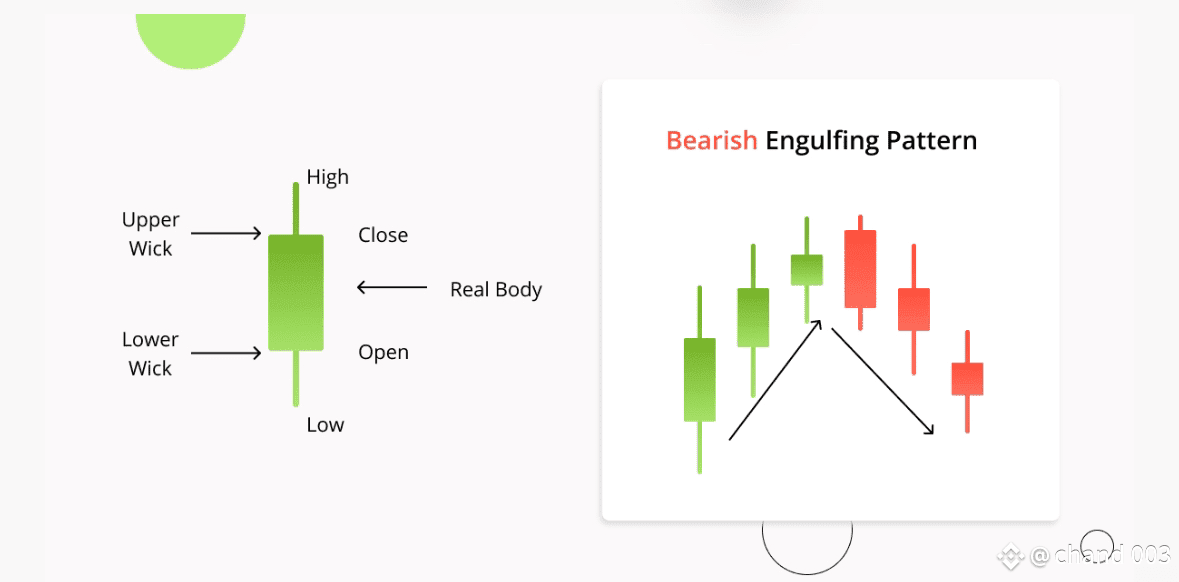
Over time, individual candlesticks form day trading patterns or reversal patterns. As seen in the image above. There are a great many candlestick patterns that indicate an opportunity within the market – some provide insight into the balance between buying and selling pressure, while others identify continuation patterns or market indecision.
With time, these separate candlesticks create different day trading patterns or reversal patterns that are used in trading chart patterns. Traders rely on analyzing these patterns to gauge support & resistance levels and to get a heads up on what’s going to happen in the market next. There are a lot of different candlestick patterns that provide traders with great opportunities.
Typically, in the market, we see the following types of trading patterns:
bullish reversal patterns,
bearish reversal patterns,
and candlestick continuation patterns.
Bullish candlestick patterns form at a market downturn and signal that the price of an asset is likely to reverse. Which would lead a trader to consider opening a long position and profit from an upward move. Whereas bearish candlestick patterns are seen at the end of an uptrend. Which lets traders know that the price of a crypto is at a heavy point of resistance and that price may fall due to buyer exhaustion. Both can be considered trend reversal patterns.
However, candlestick trading patterns don’t necessarily have to indicate a shift in the market’s direction. There exist what are known as continuation candlestick patterns that are considered as a confirmation that the trade will go on. The continuation patterns are also associated with periods of rest and sideways or neutral price movement in the market.
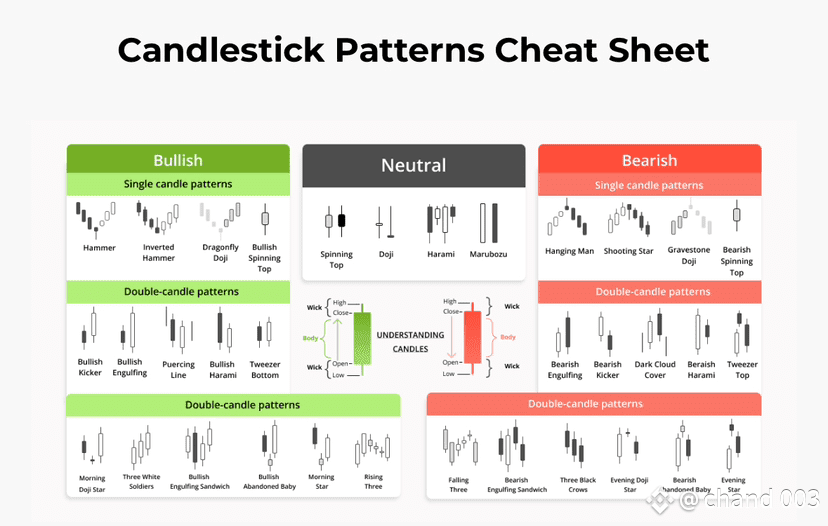
To help you quickly spot all the different types of candlestick patterns, we created this candlestick patterns cheat sheet for a quick visualization of them. Since we will cover a wide range of the most common candlestick trading patterns, having a good overview will be essential.
Candlestick Patterns Explained With Examples: How to Find and Read Them on Charts
It’s not a secret that understanding candlestick patterns will make you a powerful trader capable of making an income purely by reading candlestick patterns and trading candlestick patterns and price movements.
The real beauty here is that anyone can apply this technical knowledge and use candlestick trading patterns on any time frame and combine them with any other strategy. After reading this guide with the best candlestick patterns, you’ll easily be able to start spotting and using candlestick patterns for day trading.
So let’s get to it and over some candlestick patterns explained with examples from the Good Crypto trading app. Get ready and sit back comfortably as you learn about the most reliable candlestick patterns.
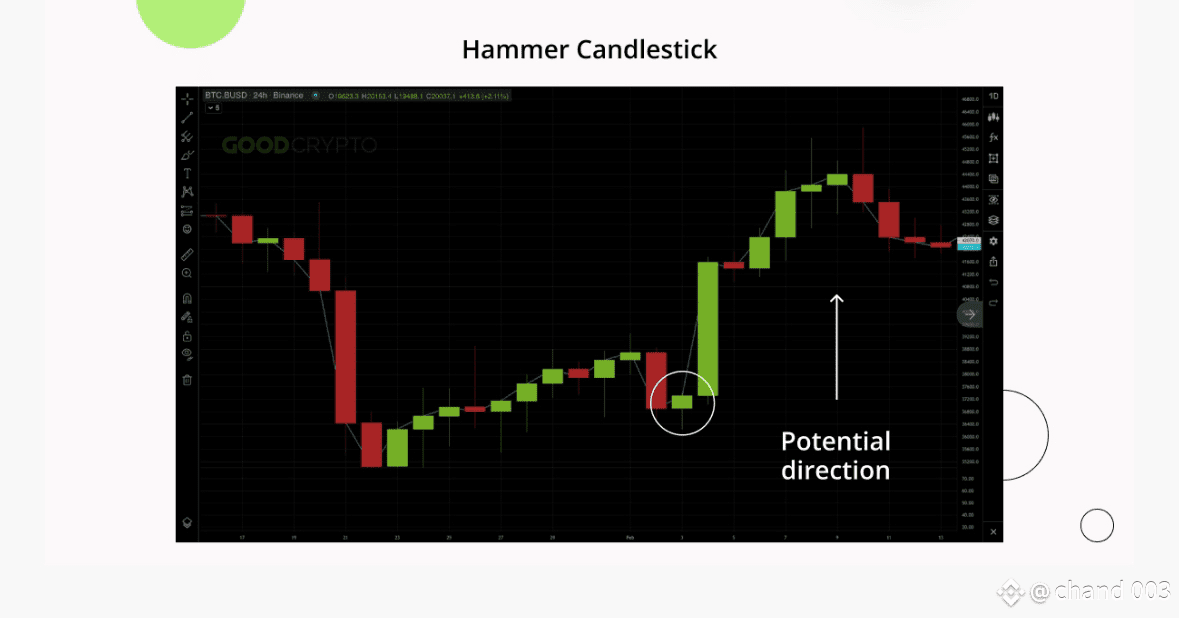
Hammer Candlestick
Hammer Candlestick
We’ll start things off with the Hammer candle. Honestly, the hammer candlestick pattern is probably the most used and taught trading pattern there is. The reason for that is that the hammer chart pattern is very easy to spot and use. Typically, bullish hammer candlesticks are found at the bottom of a market downtrend. Whereas bearish candlestick patterns are seen at the end of an uptrend.
The hammer pattern is a signal that selling pressure on an asset is weakening and that buyers are stepping in to place bids. Below is an example of a hammer candlestick pattern, which is obviously bullish.
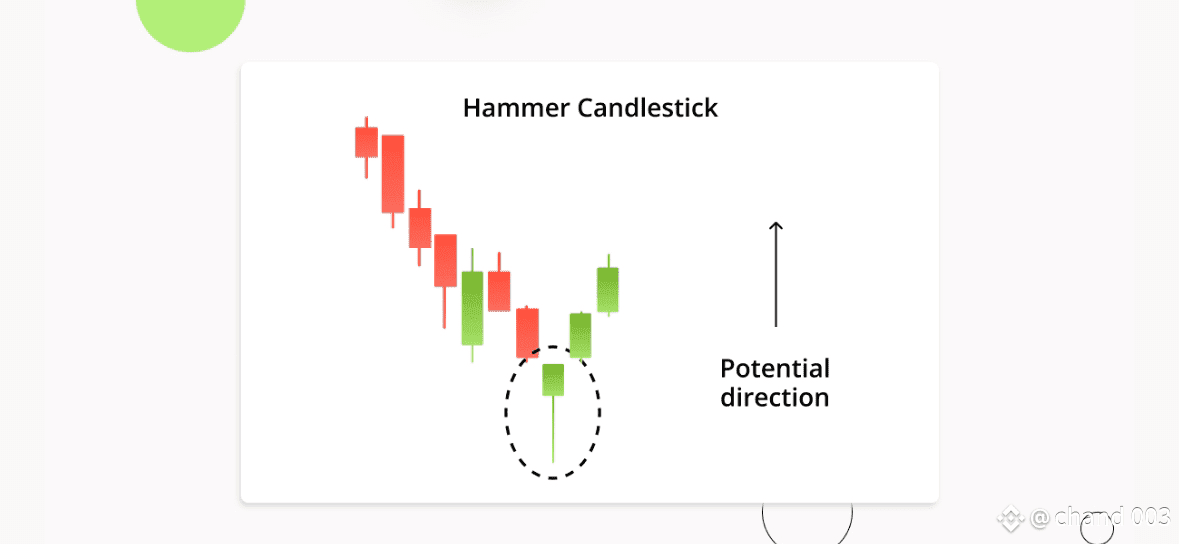 As we can see in the example above. Sellers tried to take the price as low as possible (based on the long wick), however, they were weak and buyers swooped in, resulting in the bullish hammer candlestick above. Notice the hammer-like shape of the candle? Also note that the longer the wick of the hammer in candlestick chart, the greater the buying pressure.
 Inverted Hammer Candlestick
There is also the inverted hammer candlestick. It’s also bullish, but its top wick is long while the bottom one is short. The inverted hammer pattern indicates that there was substantial buying pressure followed by some sell pressure. But ultimately that buyers ended up having greater control.
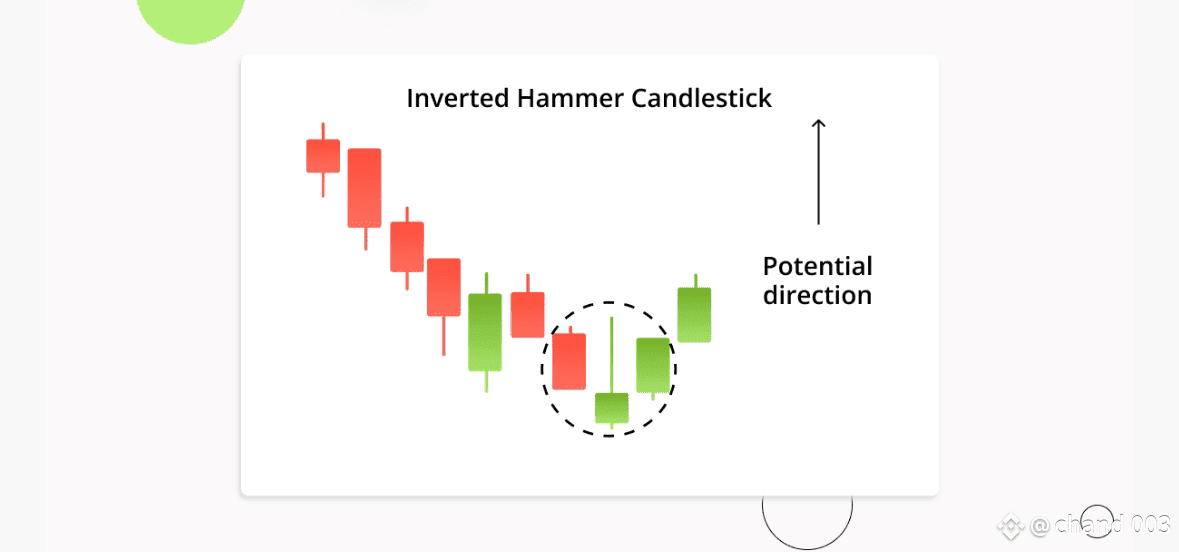
A trader would see the above inverted hammer candlestick pattern or preceding green hammer candlestick and likely feel quite confident in learning bullish and possibly opening a long with a sensible stop loss.
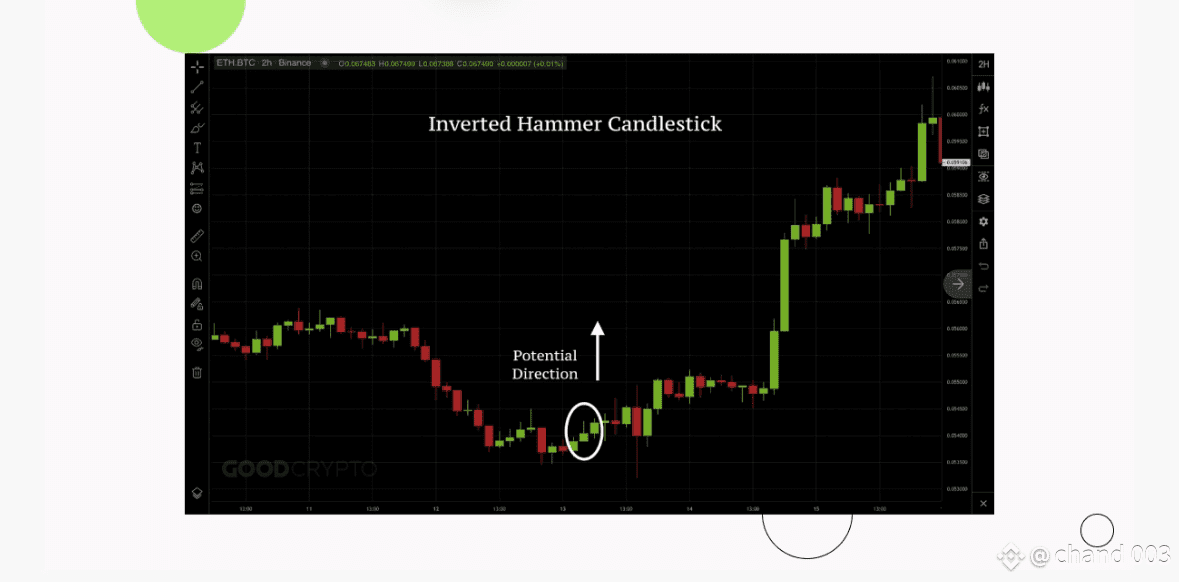
❗️Mind, as a smart trader, before setting up a position, you should also look for a few more indications of the trend reversal represented by other trading tools: trendlines, technical indicators, like Bollinger Bands, Moving Averages, or Oscillators like RSI and MACD.
Engulfing Candle
As opposed to the previous candlestick pattern, which is formed from one candle, an engulfing candle is actually a combination of two separate candlestick patterns. Traders will see two types of such patterns, either a bullish engulfing, or a bearish engulfing.
An engulfing candlestick pattern is very easy to spot on a chart. It is usually a big candlestick body with very tiny top and bottom wicks. Take a look at an example of a bullish engulfing candle pattern below:
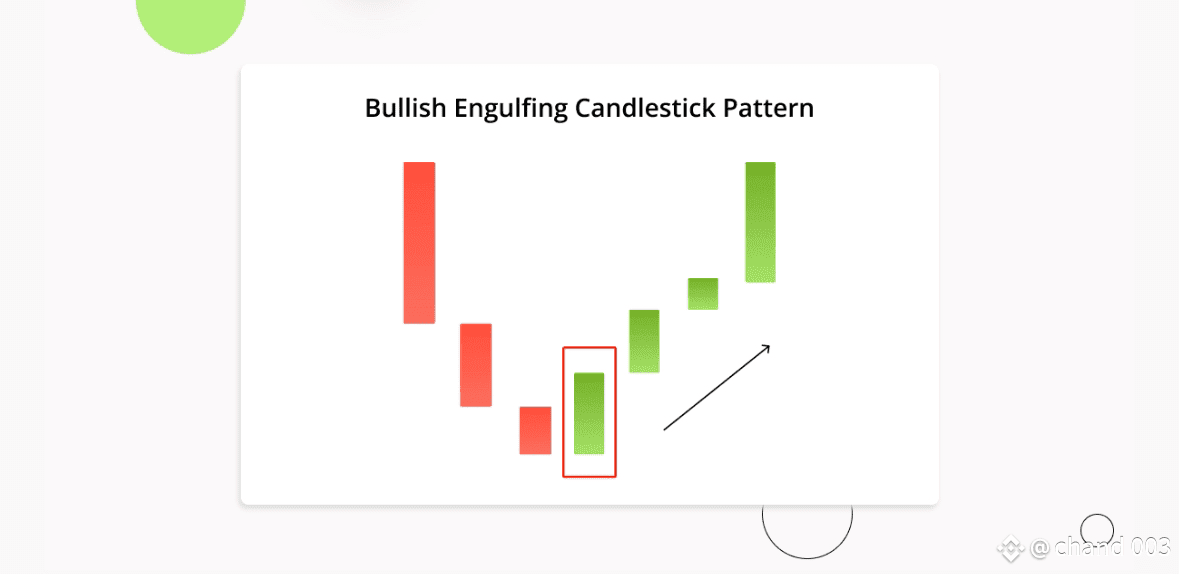
Bullish engulfing candles are typically found at the end of trends and show that bulls have assumed control of a market. As you can see, the bullish engulfing candlestick quite literally consumes the preceding candle in terms of size.
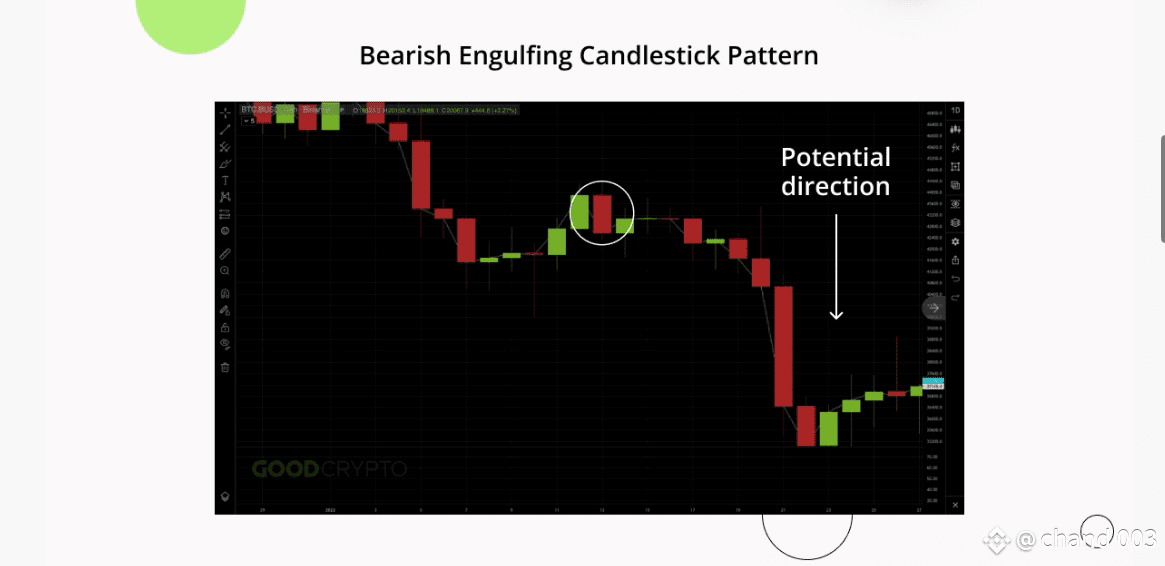
Everything in the exact opposite is true for a bearish engulfing pattern. A red and vicious candle that consumes all of the previous bullishness and reminds traders of gravity.
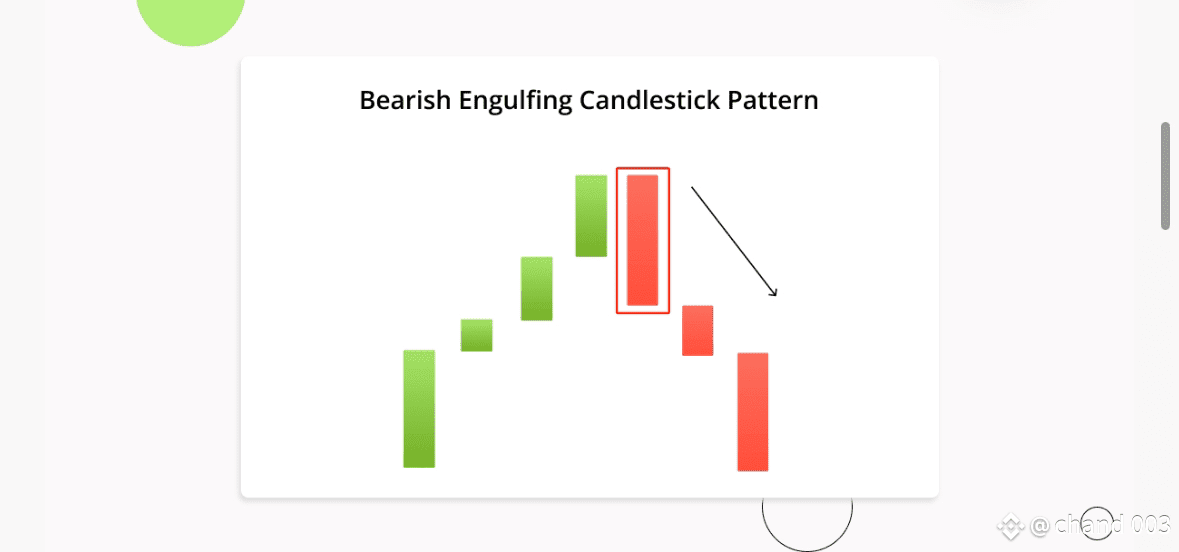
A bearish engulfing candlestick as in the example above would signal to a trader that opening a short position on an asset would be wise due to waning buyer momentum.
Three White Soldiers
The three white soldiers candlestick pattern is a little bit more complicated than the previous ones we covered. It requires more attention to spot and utilize in your pattering trading strategy because three white soldiers require a specific setup.
Although, at first glance, the pattern might just seem like 3 candles that go up consecutively. Context is key here. The three white soldiers candlestick pattern is made after consistent heavy selling.
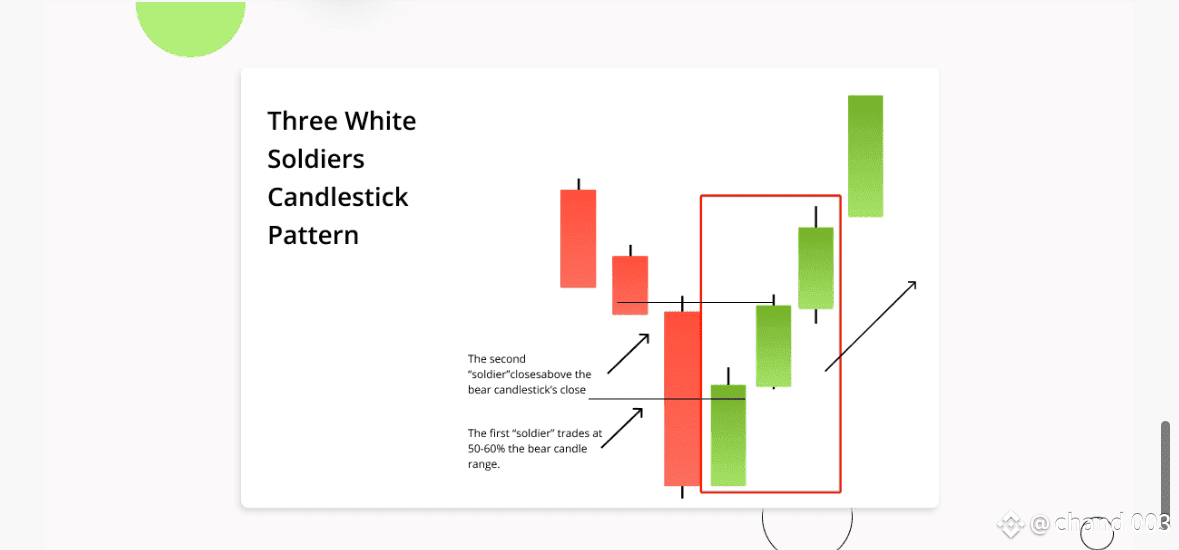
Above is an example of the three white soldiers pattern that marks a shift from a downtrend to an uptrend. Note that the candles become progressively larger too, making higher highs (HH). This is a very bullish and volatile trading pattern, which makes it quite tempting for novice traders to disregard risk management, which is a grave mistake and something that you should definitely have as part of your pattern trading strategy.

Three Black Crows
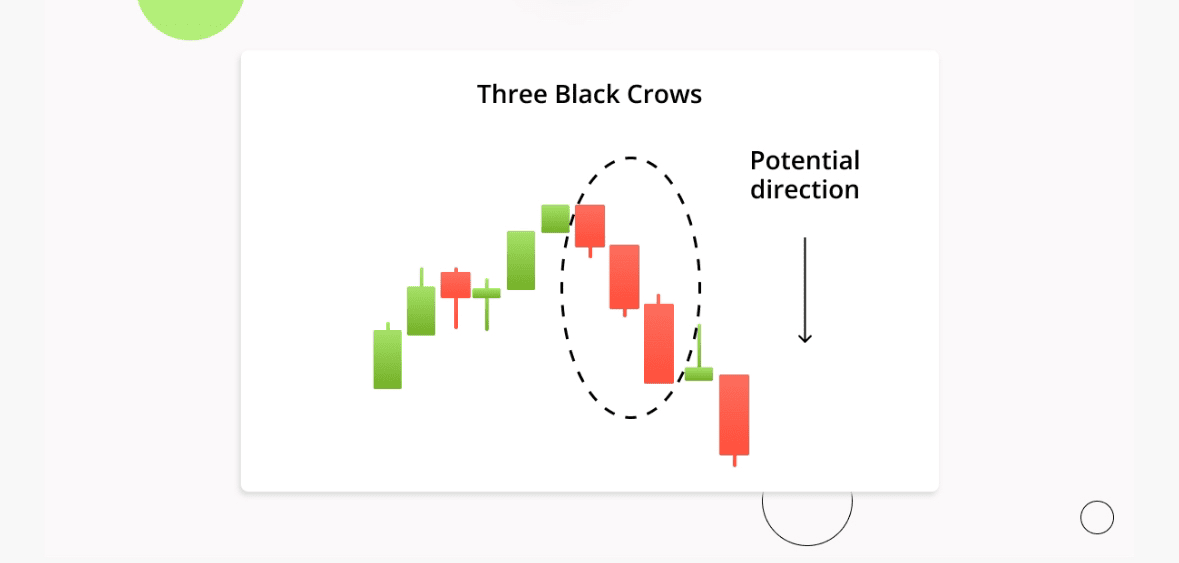
A literal bearish alternative to the previous trading pattern we just covered. The three black crows candlestick pattern consists of three strong black candles known as black crows. Some of these names are quite poetic, aren’t they? This trading pattern has to form after a big push upwards by buyers. Check out this nosedive in the market:
And if you need all candles comments $BTC $WLD