A recent technical analysis shows that Bitcoin (BTC) along with the entire cryptocurrency market is likely re-enacting the familiar pattern of post-halving cycles in the past. Although it had a strong surge in July and August, historical fractals warn of the risk of a deep correction in September, before opening up a strong rebound towards the peak cycle at the end of the year.
September: Potential risks for Bitcoin and the cryptocurrency market
A recent post on social media X by cryptocurrency analyst Benjamin Cowen has attracted attention by pointing out the repeating pattern in Bitcoin's price volatility – a factor that could play a crucial role for the market in the coming months. According to him, Bitcoin often moves in cycles after each halving, with distinctly seasonal fluctuations, especially in the months of July, August, and September.
The chart published by Cowen shows that in previous cycles, Bitcoin often broke out strongly in July and August, igniting an excited sentiment along with capital inflows into the market. However, this excitement often quickly gives way to a correction in September, forcing the market to 'reset' before entering the final upward phase towards the peak cycle – which usually occurs in the fourth quarter of each year.
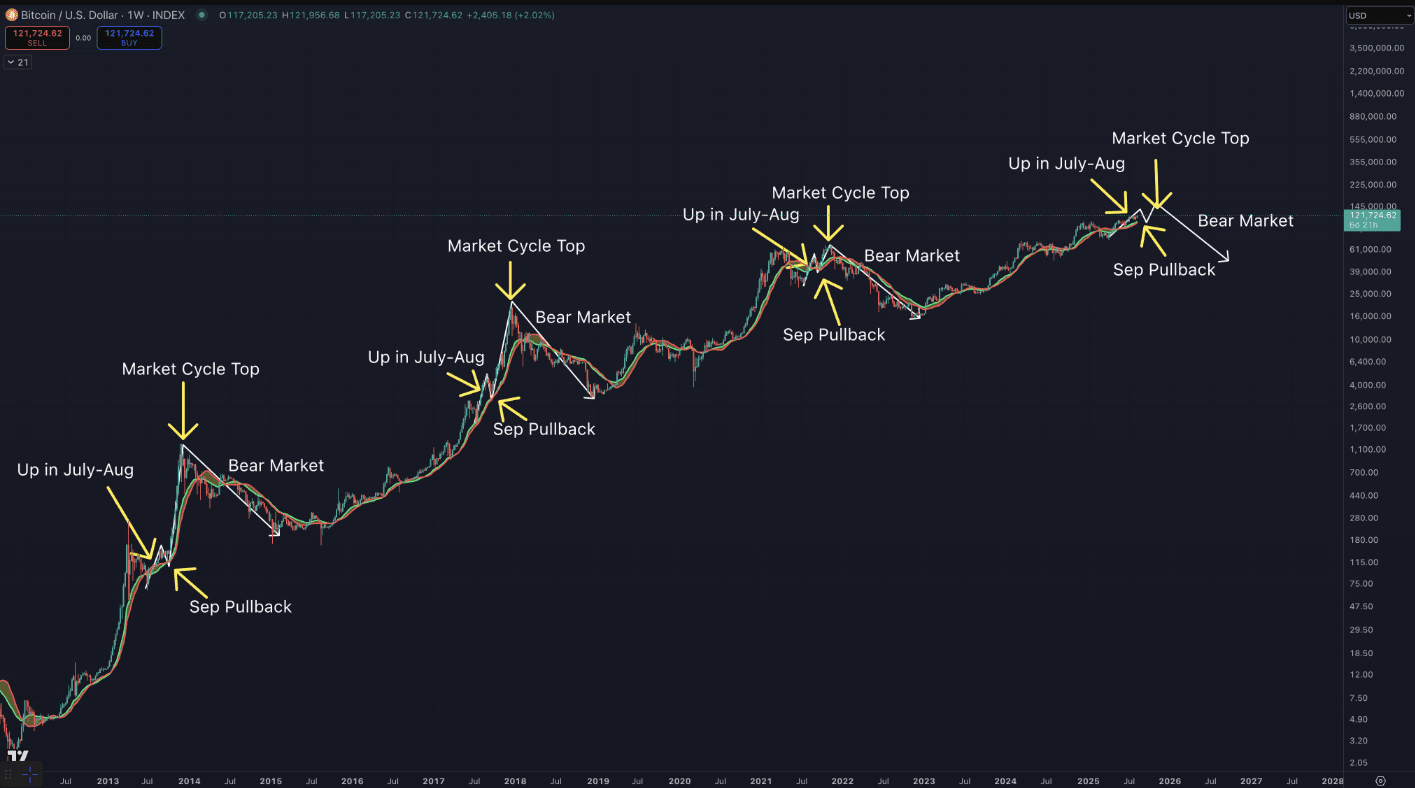
Notably, this pattern is not an isolated phenomenon. In the years 2013, 2017, and 2021, Bitcoin's price exhibited similar behavior: a strong increase in mid-summer, but a notable weakening in September. After the peak cycle, the market continuously enters a prolonged 'crypto winter' phase, when prices drop sharply from the highs.
Based on Cowen's analysis, the current cycle seems to be following the familiar script: Bitcoin has shown significant strength in July and August this year, raising concerns that a correction in September may be imminent.
BTC cycles indicate that the market still has room for growth
According to cryptocurrency market analyst TechDev, a familiar pattern is repeating in Bitcoin's long-term price cycles. Contrary to the popular belief that BTC is nearing its peak, this analysis suggests that the market is still quite far from the maximum threshold. The evidence is reinforced by historical data, which shows that every peak cycle of Bitcoin usually occurs about 14 months after a significant cycle signal.
The chart illustrates the price cycles of Bitcoin since 2011, with peaks and troughs prominently marked in green and red. A common point is that each strong growth phase is soon replaced by a deep correction, before the market enters a phase of accumulation and recovery. Notably, the peaks of the cycles almost always coincide with a timeframe of about 420 days.
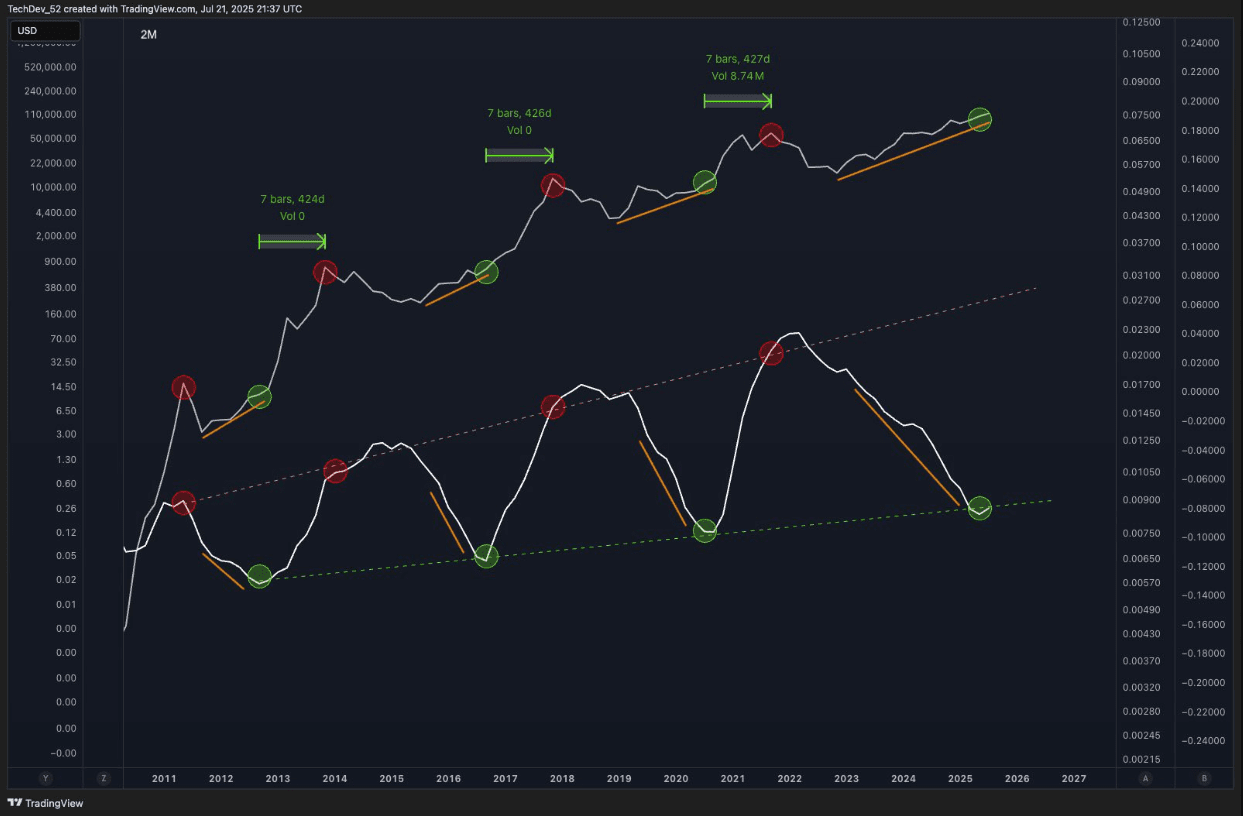
Based on this model, current forecasts indicate that Bitcoin still has significant room for growth. The latest green signal on the chart suggests that the market may have emerged from the correction phase. If history repeats itself, this means Bitcoin is preparing to enter a sustainable growth cycle, rather than nearing exhaustion.