$BTC On the 1-hour chart, Bitcoin displayed a weakening market structure characterized by a series of lower highs and lows following a local peak at $119,336.
Despite a slight bounce at $116,856, the lack of volume confirmed the weakness of bullish presence, reinforcing the bearish outlook.
A breakout below $117,000 suggested the possibility of a short position targeting the $116,000 range.
On the other hand, a return to the $118,500–$119,000 zone with convincing volume could nullify the downward trend in this timeframe.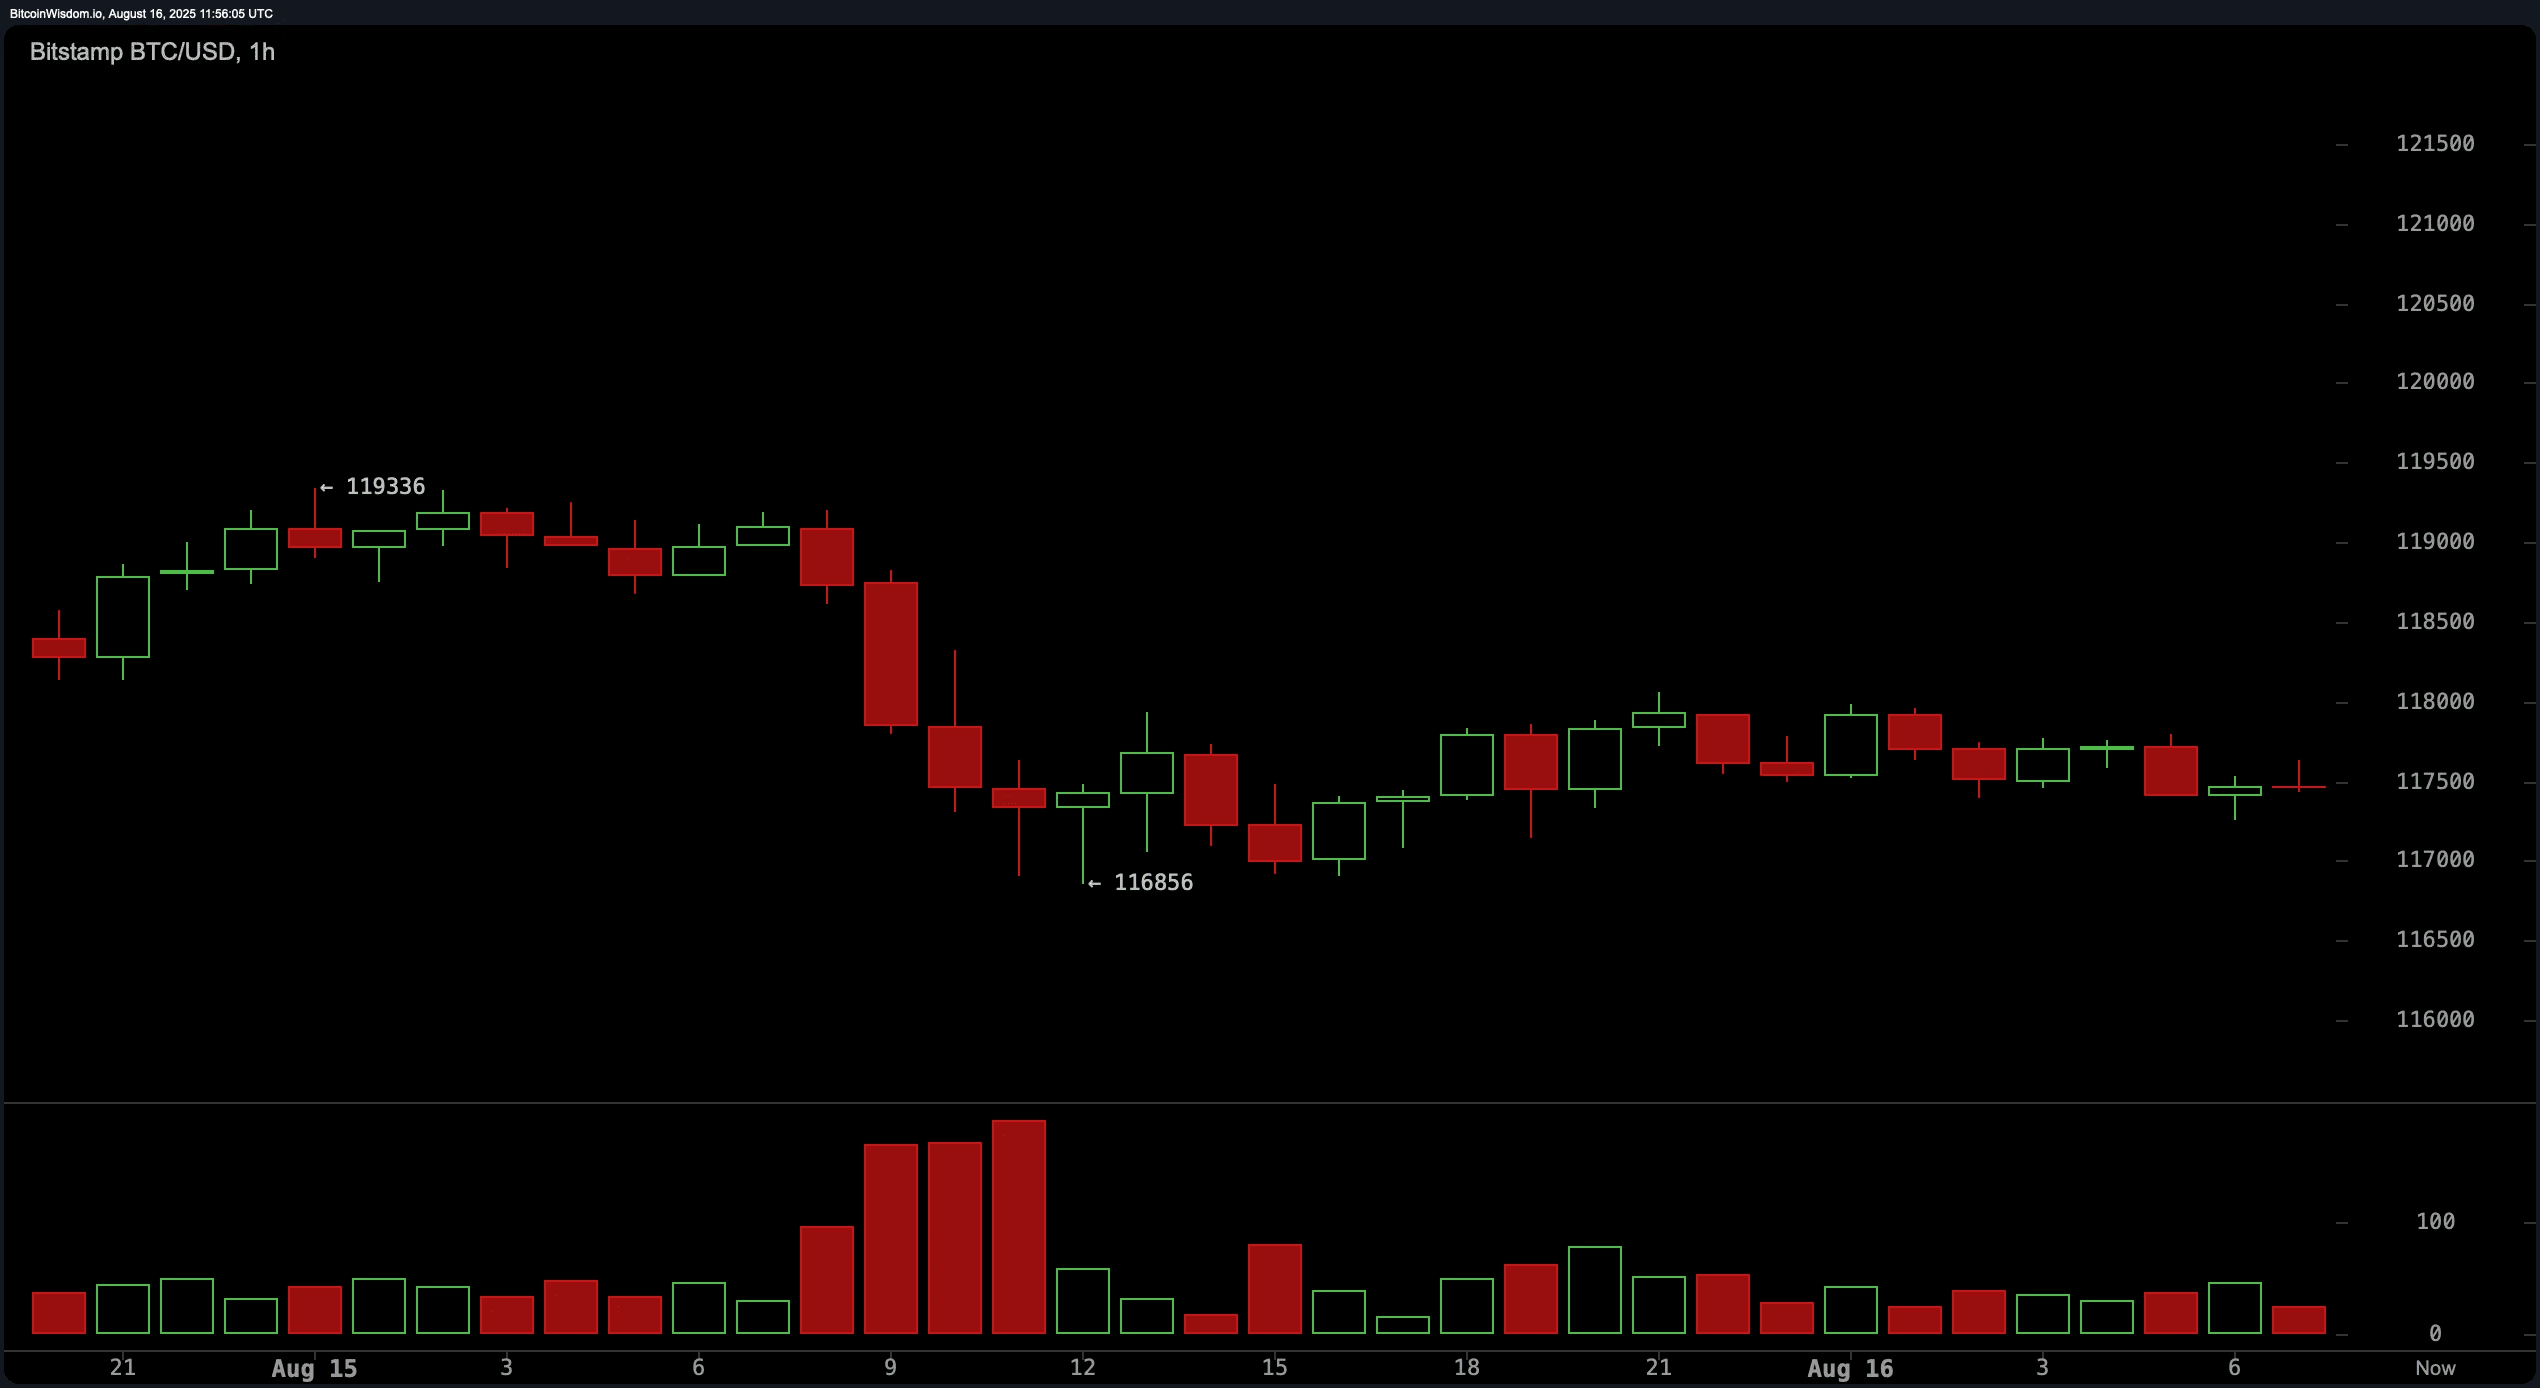
===========
The 4-hour chart of Bitcoin reflected a sharp decline from the $124,517 high to $116,856, after which Bitcoin entered a narrow consolidation range between $117,000 and $119,000.
Such behavior in the range indicated a lack of confidence in the market and is typically seen as a phase of absorption following a strong impulse.
A sustained breakout above $119,500 could signal a short-term recovery, with the nearest resistance being the $121,000 level.
However, a breakout below $116,500 on strong volume is likely to accelerate the decline to the $114,000–$111,000 range.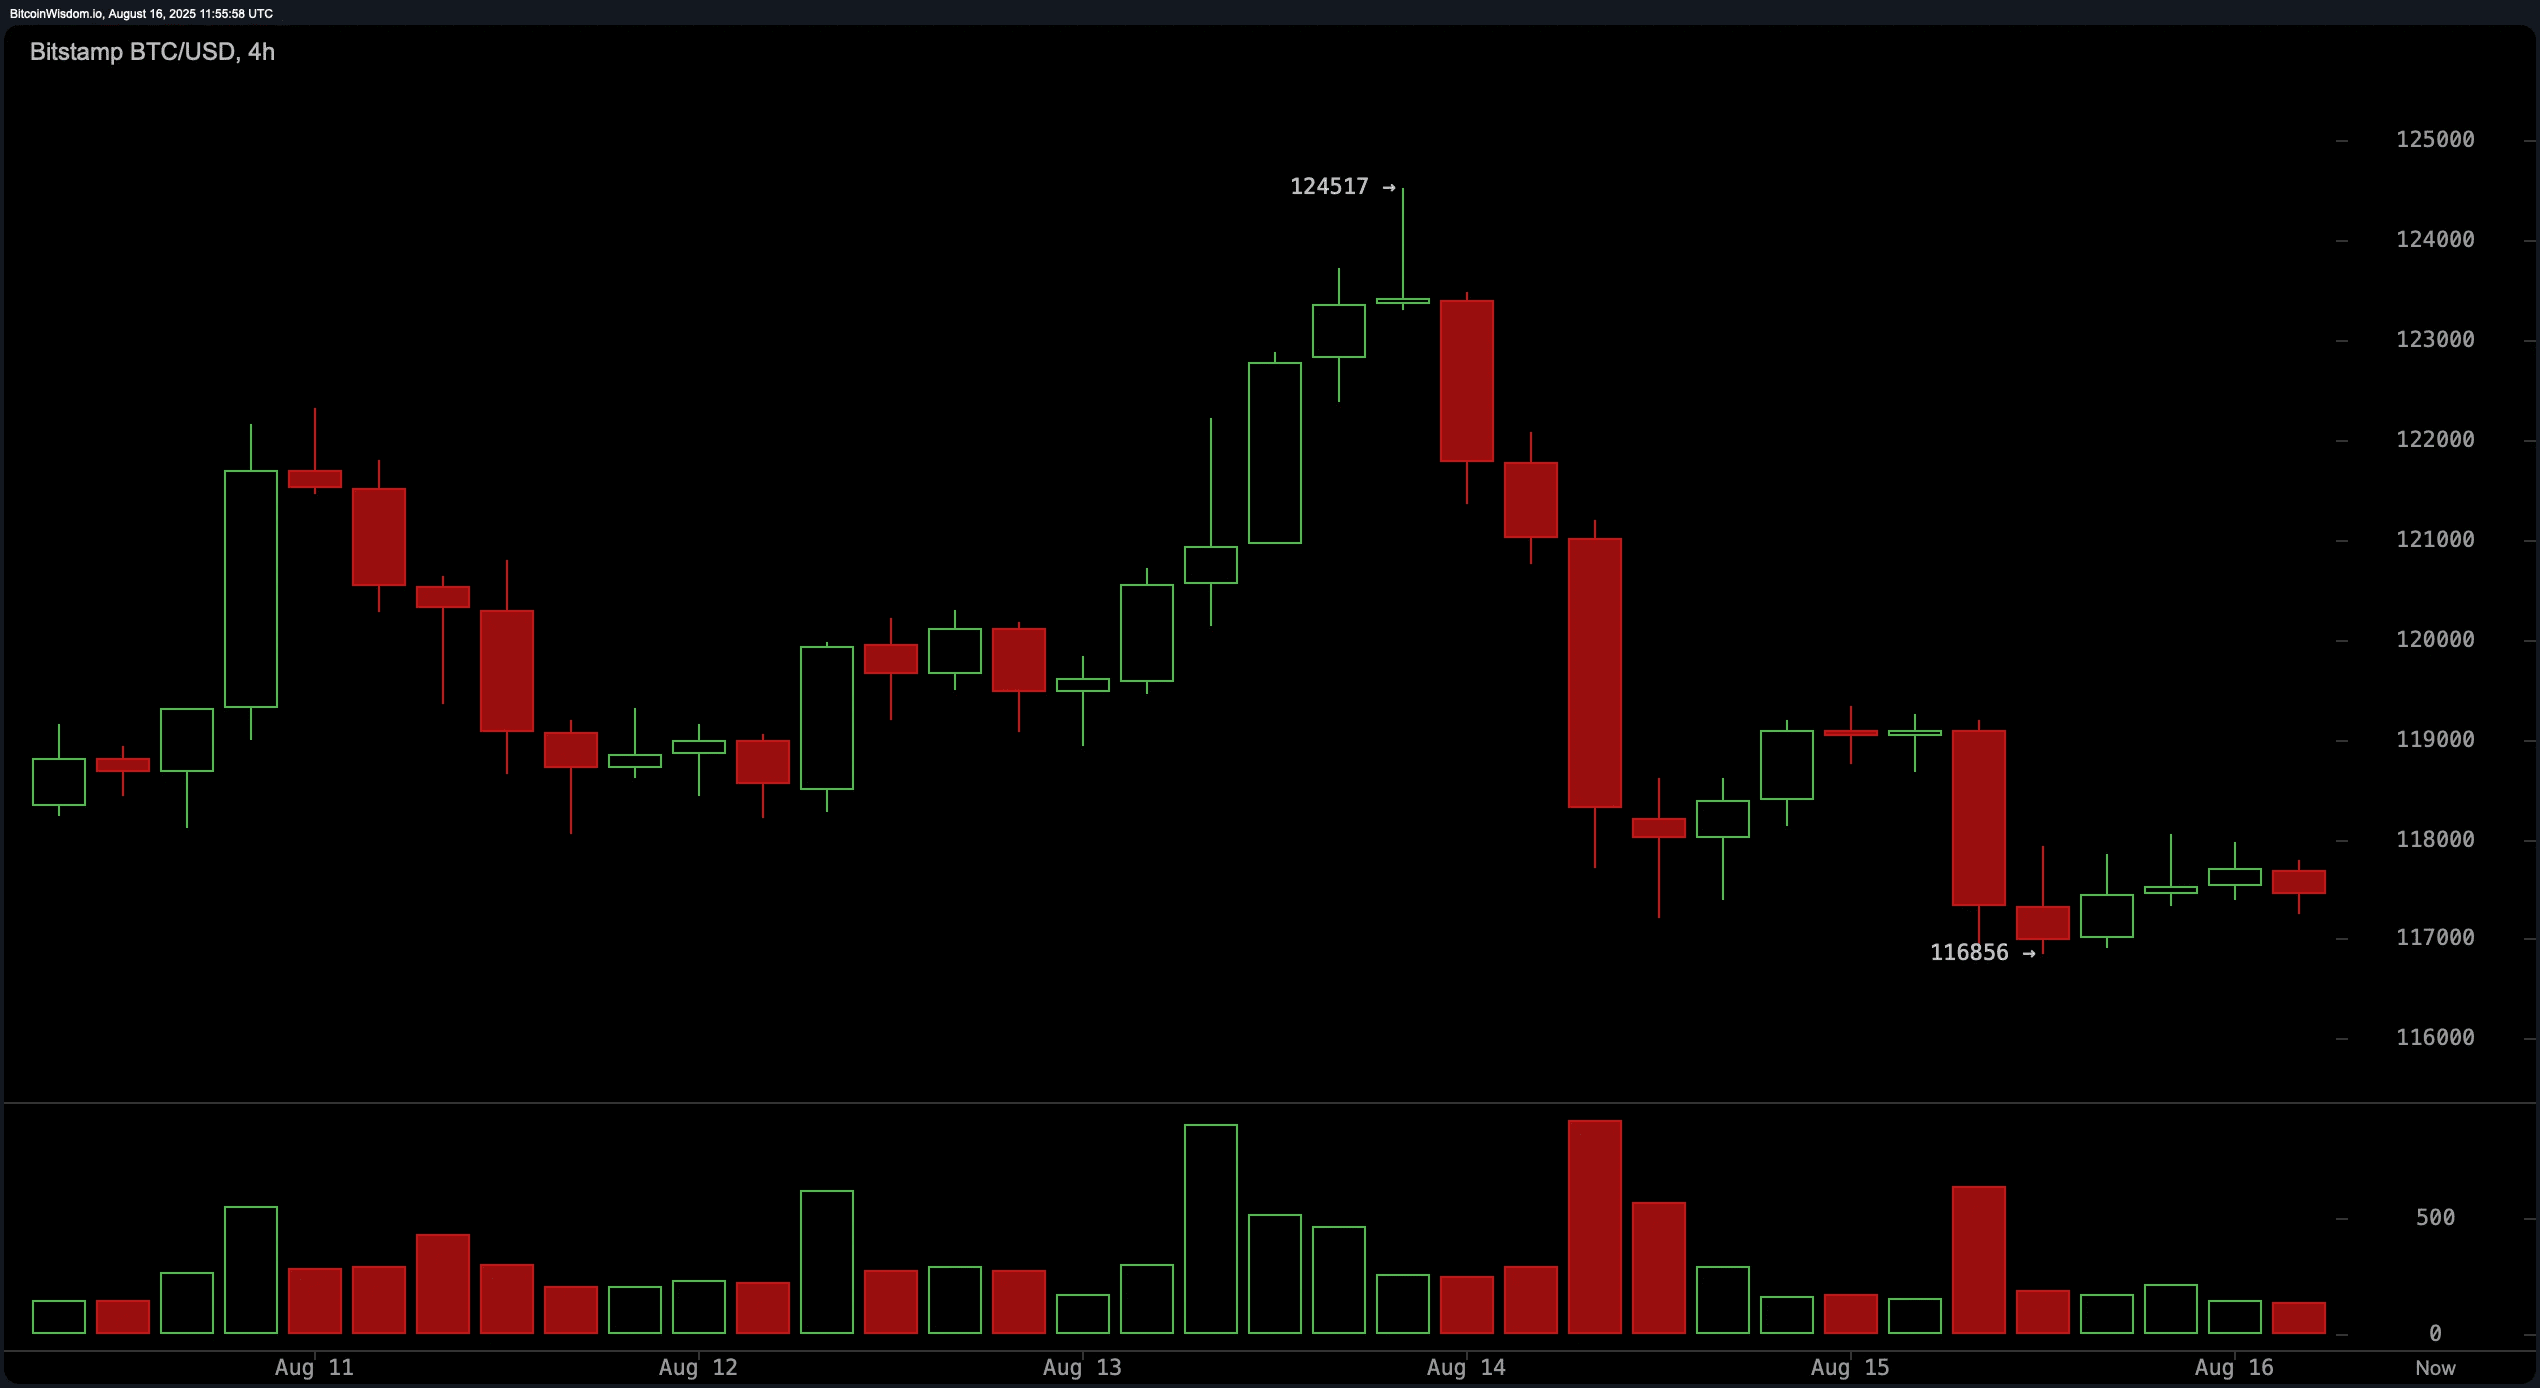
=========
The daily chart of Bitcoin showed a high of $124,517, followed by a strong bearish engulfing candle, which often precedes a trend reversal.
The inability of Bitcoin to hold above $124,000, combined with peak volume at the top, indicated distribution. Support emerged around $117,000, acting as a critical decision-making level.
If price action resumes and closes above $119,000 with substantial volume, a renewed rally may materialize; otherwise, further deterioration to the $114,000–$111,000 region is likely.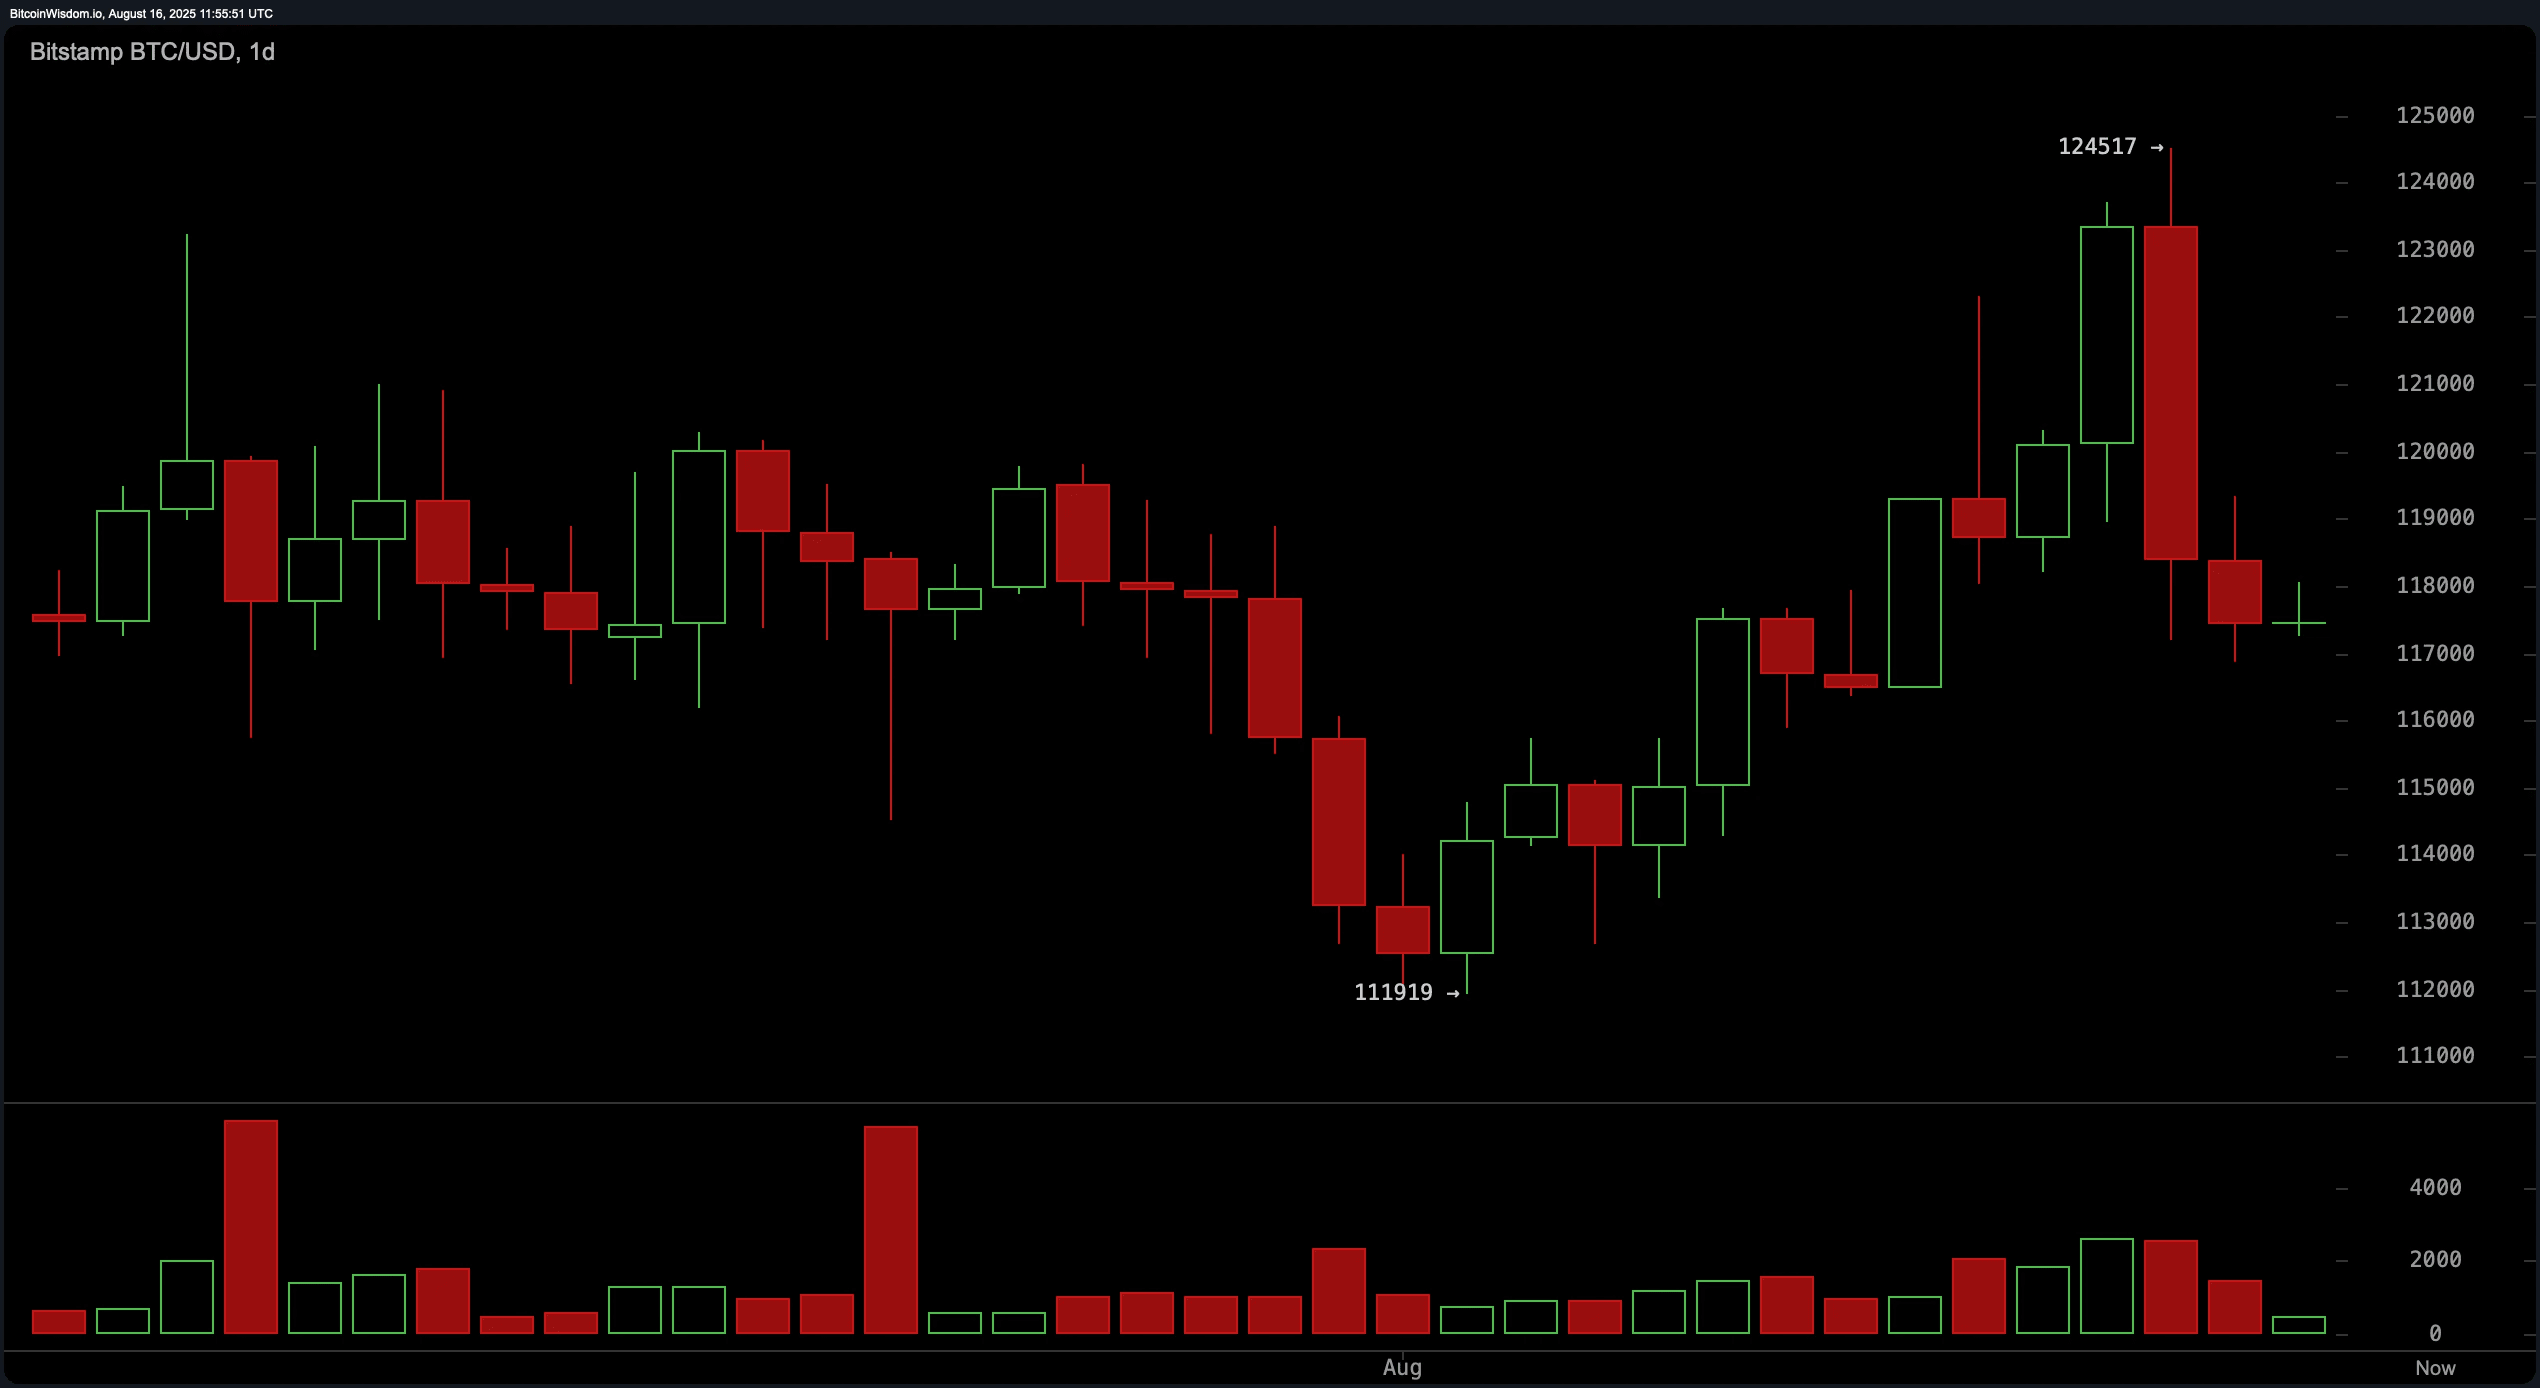
==========
Bullish verdict:
Although Bitcoin is currently trading below several short-term moving averages and is struggling to regain momentum, long-term technical indicators remain supportive.
If buyers can reclaim the $119,000 level with strong volume confirmation, it could trigger a short-term reversal and a potential rally to the $122,000–$124,000 range.
Bullish momentum will be further supported by a buy signal from the Moving Average Convergence Divergence (MACD) indicator and the alignment of long-term moving averages trending upwards.
========
Bearish verdict:
Despite periodic support around $117,000, the inability of Bitcoin to hold at higher levels along with neutral-bearish oscillator signals and weakening short-term structure leaves the market vulnerable to further declines.
If the price breaks and closes below $116,500 on increased volume, this will open the way for a decline to the $114,000–$111,000 range.
As long as Bitcoin does not decisively overcome the $119,000 resistance zone, bearish momentum will continue to dominate in the near term.

