
$NOT
Frame: Daily (1D)
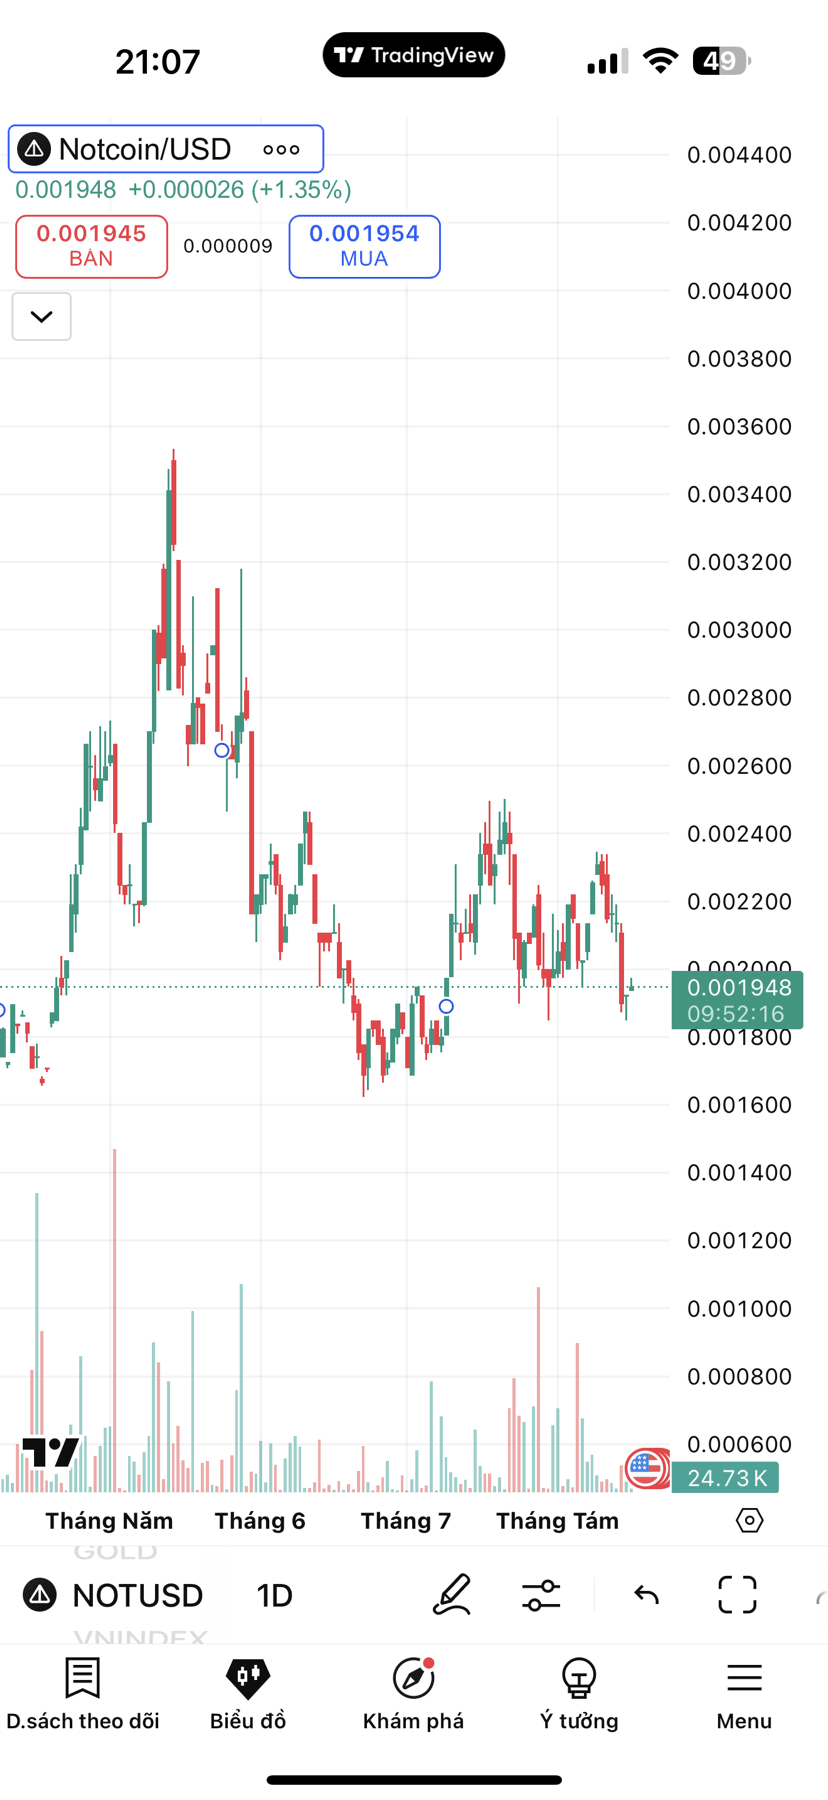
Overall Trend
Since May, the price of NOT has had many strong increases and decreases, but in general, it is still in a wide sideways trend (fluctuating around 0.0016 - 0.0028).
There is no sign of a sustainable uptrend yet, but the bottom is gradually moving higher → potential for accumulation.
Support & Resistance
Strong support zone: 0.0018 – 0.0019 (current price is retesting this zone).
Near resistance zone: 0.0022 – 0.0023.
Stronger resistance: 0.0028 – 0.0030 (old peak in June).
Candles & Volume
Recent candles show that the sellers are pressing down, but the selling pressure is not too strong because the trading volume is not explosive.
If the 0.0018 zone is held, the possibility of a short-term recovery to 0.0022 is quite high.
Technical indicators (from chart)
RSI (if on) may be in neutral zone → room to increase.
MACD is likely to cross up if price bounces off support.
📊 Script
Positive: Hold above 0.0018 → bounce back to 0.0022 area, further to 0.0028.
Negative: If 0.0018 is broken, it can fall to 0.0016.
👉 Summary: Currently, NOT is in the short-term potential buying zone if it holds 0.0018, but needs confirmation volume. The medium-term trend is still sideways, to breakout it must surpass 0.0028 with strong volume.
Project @The Notcoin Official

