Overview
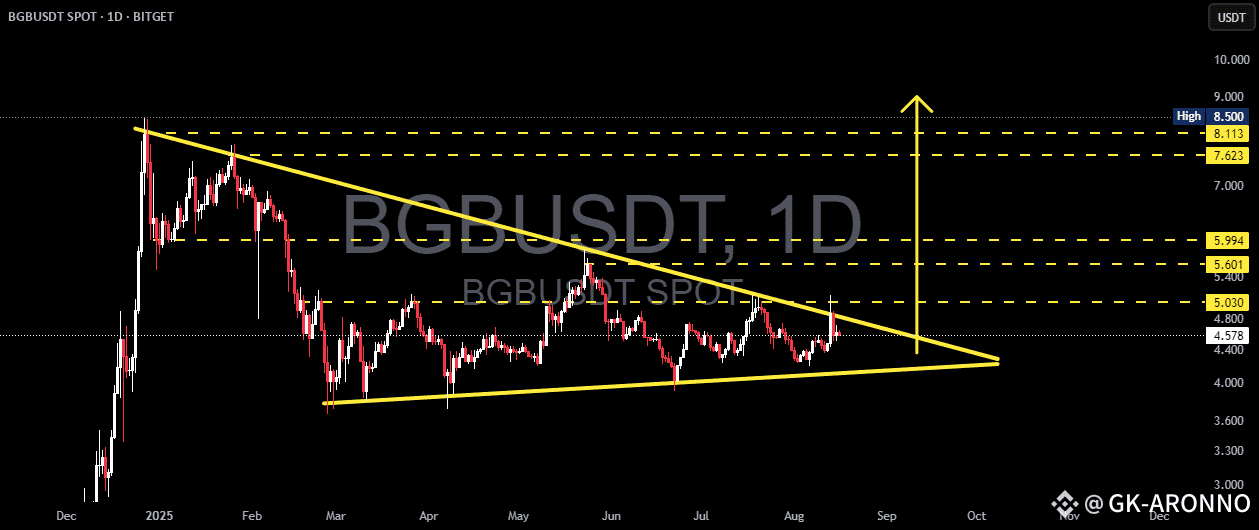
BGB/USDT is consolidating within a symmetrical triangle pattern (descending resistance + slightly ascending support) as volatility narrows toward the apex. The price is currently around 4.58, after a rejection near the upper trendline — possibly a liquidity grab. This setup usually precedes a strong move once a valid breakout or breakdown occurs.
---
Pattern Explanation
Type: Symmetrical / contracting triangle
Key characteristics: Shrinking volatility, lower highs + higher lows, volume gradually decreasing.
Context: The structure formed after a strong correction from highs, which often implies a continuation bias unless a clear bullish breakout emerges.
---
Key Levels
Current price: 4.58
Near-term resistance: 5.03 → 5.60 → 5.99
Major resistance zones: 7.62 → 8.11 → 8.50 (ATH zone)
Support: Triangle base (dynamic support around 4.0–4.4), then 3.60 and 3.00 if breakdown continues.
---
Bullish Scenario (confirmation required)
Confirmation: Daily close above the upper trendline with strong volume and successful retest.
Entry idea: Conservative entry above 5.03 with retest confirmation.
Targets:
TP1: 5.60
TP2: 5.99
Aggressive: 7.62 → 8.11 → 8.50
Measured move projection: (8.50 − 3.60 = 4.90). Breakout from ~5.03 could project up to 9.93 (theoretical target).
Invalidation: Failure to hold above 5.03 or a rejection back inside the triangle.
Stop-loss: Below retest breakout (~4.40) or below triangle support.
---
Bearish Scenario (confirmation required)
Confirmation: Daily close below triangle support with above-average volume.
Entry idea: Short entry after breakdown + failed retest.
Targets:
TP1: 4.00
TP2: 3.60
TP3: 3.00 (if strong continuation).
Invalidation: Daily close above the upper trendline or reclaim above 5.03.
Stop-loss: Above failed breakout level or triangle resistance.
---
Things to Watch
Volume: Breakouts without volume are often fakeouts.
Retest: Strong confirmation if old resistance turns into new support (bullish) or old support flips into resistance (bearish).
Daily candle close: Wick alone is not reliable; wait for candle close.
Market correlation: BTC and ETH trends may influence BGB’s breakout direction.
---
Risk Management Notes
Limit risk per trade (1–2% capital).
Use scaling entries if breakout is sharp.
Always set stop-loss and take-profit in advance.
Be cautious of false breakouts — triangles often fake one side before moving in the opposite direction.
---
Conclusion:
BGB/USDT is consolidating in a symmetrical triangle, signaling a potential big move ahead. For bulls, watch for a close above 5.03 with volume. For bears, confirmation comes with a close below triangle support. Until then, the setup remains neutral.
> Disclaimer: This is not financial advice. Do your own research and manage risk accordingly.
