In the noisy world of crypto where tokens rise and fall on both hype and utility, BubblesMaps (BMT) is carving a niche as more than just another project. It isn’t trying to sell a narrative of empty promises—it’s solving a real problem: how to make blockchain data transparent, visual, and easy to digest. With its growing traction and availability on major exchanges, traders are now asking a critical question: what’s next for the price?
To answer that, let’s break down the market structure, technical indicators, and potential scenarios that may guide BMT’s next moves.
🔹 Market Snapshot
Trading Pair: BMT/USDT
Current Price: 0.0756 (as of August 16, 2025)
24h Change: -2.33%
24h High / Low: 0.0786 / 0.0746
24h Volume: 18.5M BMT (~1.42M USDT)
The numbers reveal a market in steady motion rather than explosive growth, suggesting that traders are cautiously active, waiting for the next decisive shift.
🔹 Technical Breakdown
1. Price Structure (4H View)
BMT recently dipped to a local floor at 0.0732, before showing signs of life with a mild bounce.
Resistance Zones: 0.0786–0.0800
Support Range: 0.0730–0.0740
A slip under 0.0730 could invite sellers to drag it closer to the psychological 0.0700 level, but holding this zone would strengthen the case for accumulation.
2. Moving Averages (MA Signals)
MA(7): 0.0764
MA(25): 0.0802
MA(99): 0.0790
Short-term momentum is tilted bearish, as the 7-day MA sits beneath both the mid- and long-term averages. Yet, price refusing to break below its recent low hints that selling exhaustion may be near.
3. MACD Indicator
DIF: -0.0019
DEA: -0.0016
Histogram: -0.0003
Momentum is still fragile, but the flattening histogram is a sign that downward pressure is fading. A crossover here could trigger a short-term rebound.
4. Volume Story
Daily trading activity around 1.42M USDT suggests quiet but steady accumulation. A sharp spike in volume will likely mark the beginning of the next major leg, whether up or down.
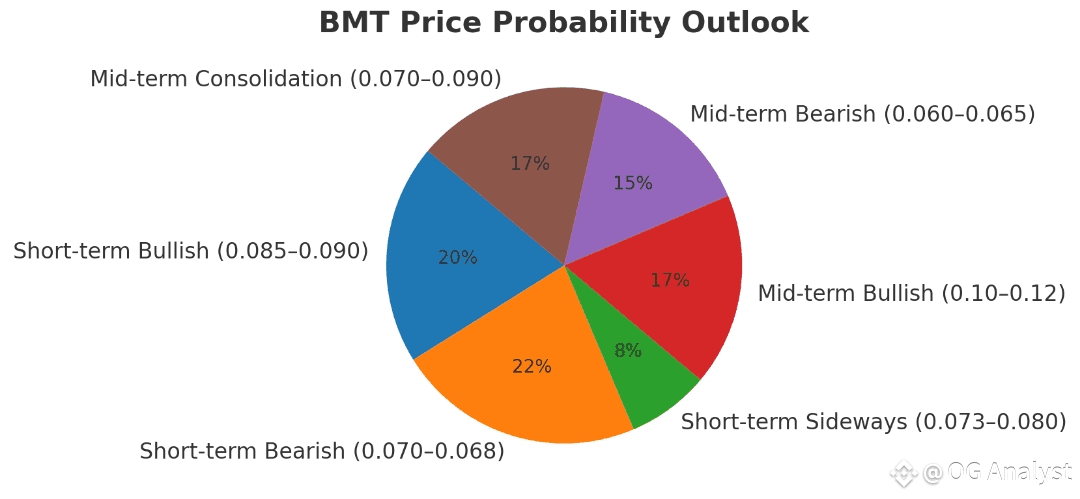
🔹 Price Outlook
Short-Term (1–2 Weeks)
Bullish Case: Holding above 0.0732 and piercing through 0.0800 could unlock a move toward 0.085–0.090.
Bearish Case: Failure to defend 0.0730 may bring a correction to 0.070–0.068.
➡️ Overall bias: neutral-to-bearish until volume expansion confirms strength.
Mid-Term (1–3 Months)
Likely Range: 0.070–0.090 (consolidation phase)
Upside Potential: A bullish reversal could carry BMT to 0.10–0.12 if adoption of its visualization tools accelerates.
Risk Zone: Persistent bearish macro conditions could push the token down toward 0.060–0.065.
🔹 Why BMT Matters Beyond the Chart
Numbers tell one side of the story, but BMT’s value lies in its core mission:
1. Transparency in Web3 – BubblesMaps transforms raw blockchain data into bubble-style maps, making it easier to track whale clusters, token distribution, and potential risks.
2. DeFi’s Need for Trust – With scams and rug pulls still haunting the industry, tools like this are becoming essentials, not just add-ons.
3. Exchange Support – Wider trading access gives BMT the liquidity and visibility that many early-stage projects lack.
This blend of technical resilience and real-world utility positions BMT as more than just a speculative play—it’s a project aligning with the crypto community’s demand for accountability.
🔹 Final Word: Buy, Hold, or Wait?
For short-term traders: The key battleground lies between 0.073 support and 0.080 resistance. Until one side breaks, range-trading could be the strategy of choice.
For long-term believers: BMT’s consolidation phase offers an entry opportunity before any larger adoption-driven rally. If the project continues to grow its role in crypto transparency, a climb toward 0.10–0.12 is realistic in the coming months.
👉 In essence, BMT is not in a hype cycle—it’s in a building phase. That means patience and smart positioning at support levels could reward those who believe in the bigger picture.
$BMT #Bubblesmaps @Bubblemaps.io