Hey friends, do you feel that the cryptocurrency market is profound and mysterious, and those complex charts are overwhelming? Don't worry, today I'll explain what a candlestick chart is in plain language!
What is a candlestick chart? A candlestick chart is like a 'diary' of stock prices, recording the price changes of a stock in a very intuitive way over a day. Each candlestick represents a day and contains four key pieces of information: opening price, closing price, highest price, and lowest price.
What does a candlestick chart look like?
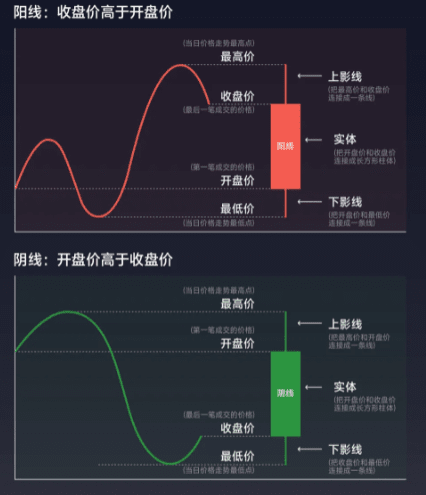
Bullish candle (closing price higher than opening price): usually represented in red or blank, shaped like a burning candle, indicating that the stock rose that day.
Bearish candle (closing price lower than opening price): usually represented in green or black, shaped like a candle, indicating that the stock fell that day.
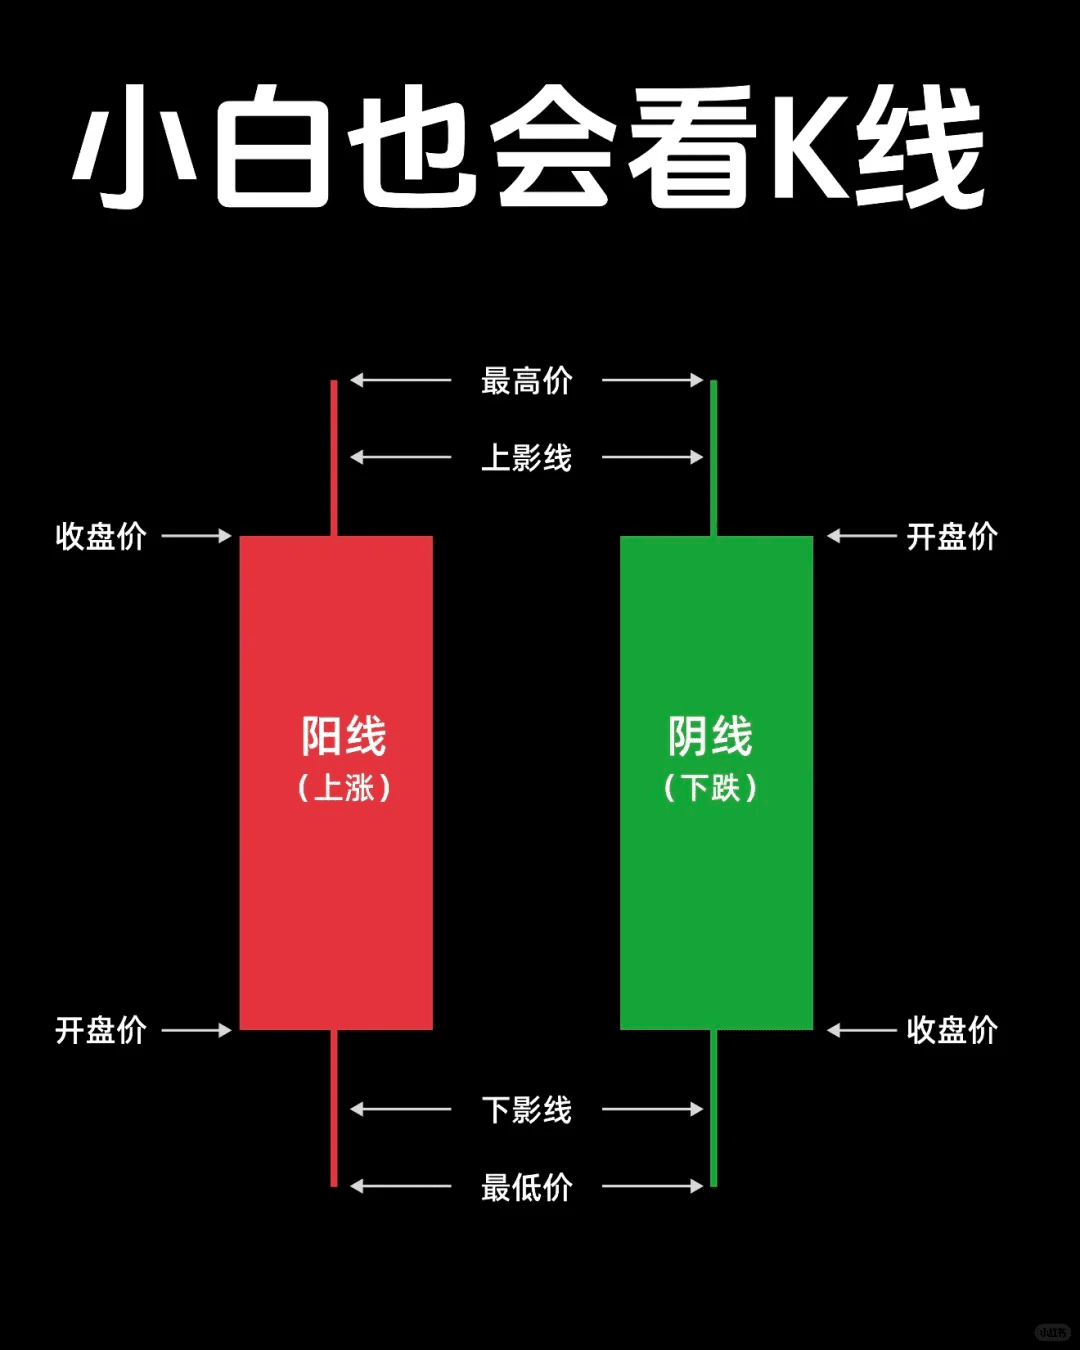
Components of a candlestick chart:
Body: The rectangular part in the middle of the candlestick, representing the difference between the opening price and closing price.
Upper shadow: The line above the candlestick, indicating the difference between the highest price and the top of the body.
Lower shadow: The line below the candlestick, indicating the difference between the lowest price and the bottom of the body.
Why is the candlestick chart useful? The candlestick chart is important because it helps us quickly understand the price trends of stocks. By observing the shape and color of the candlesticks, we can determine whether the stock is rising or falling, allowing us to make wiser investment decisions.
Tip:
The shape and color of bullish and bearish candles can visually help us see the rise and fall of stocks.
The length of the body and shadows of the candlestick can tell us the magnitude of price fluctuations.
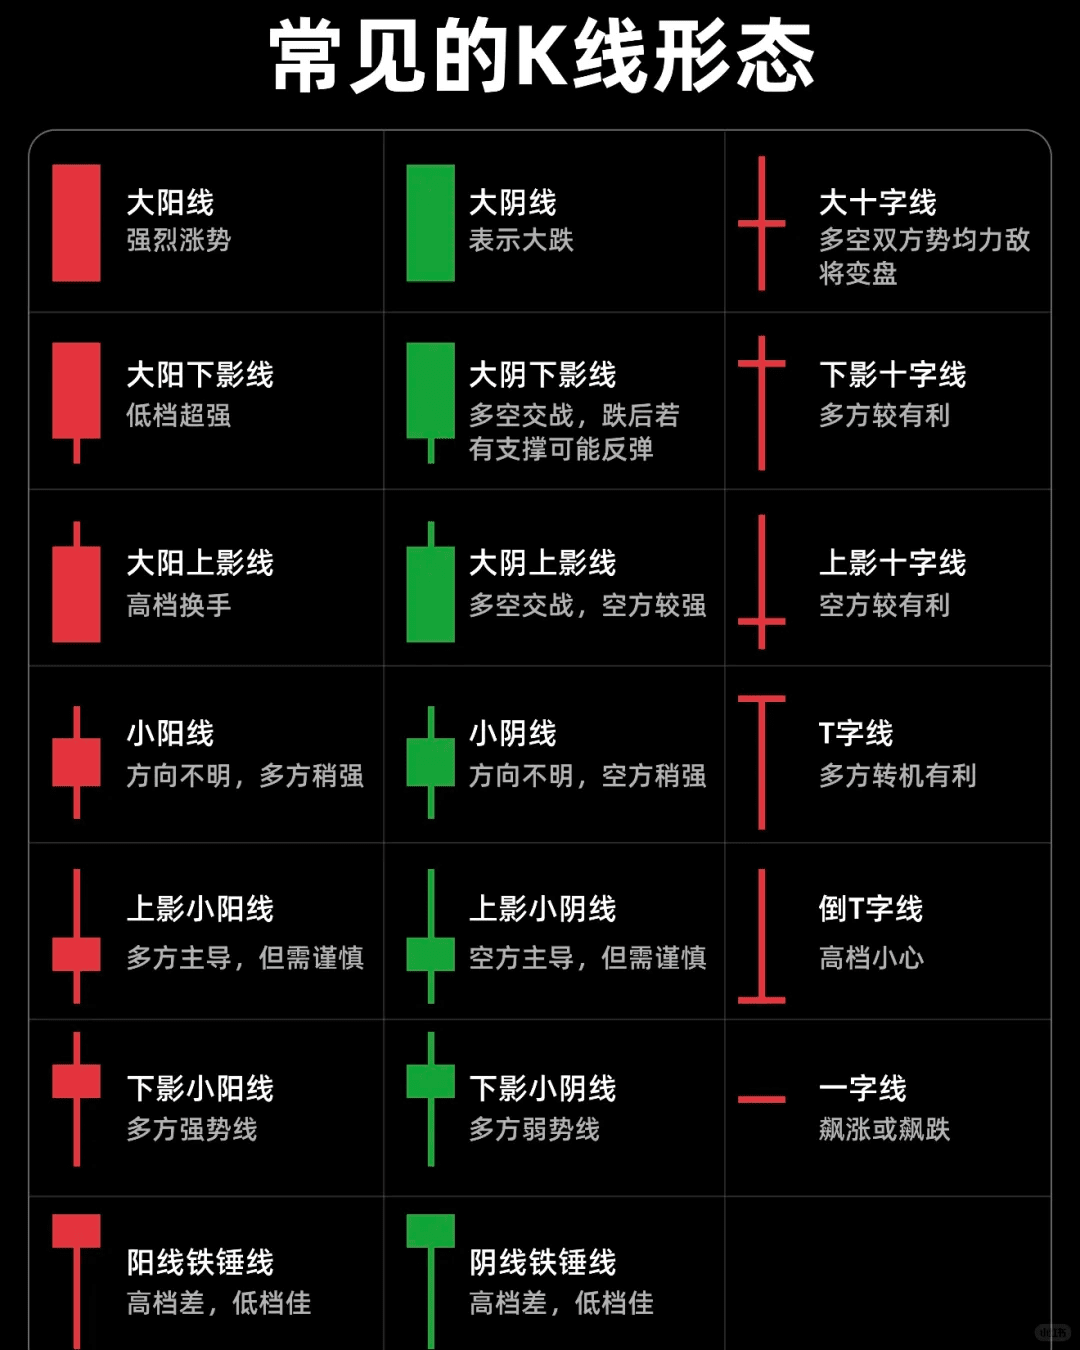
Common candlestick patterns:
Small bullish candle: bullish sentiment weak.
Medium bullish with upper and lower shadows: bullish sentiment strong.
Lower shadow limit up: very strong bullish sentiment.
Hammer: bullish at the bottom.
Large bullish candle with no upper shadow: bullish advantage.
Doji: stalemate and potential reversal.
Inverted hammer: bearish signal.
Upper shadow limit down: large bearish escape.
Large bearish candle with no upper shadow: bearish advantage.
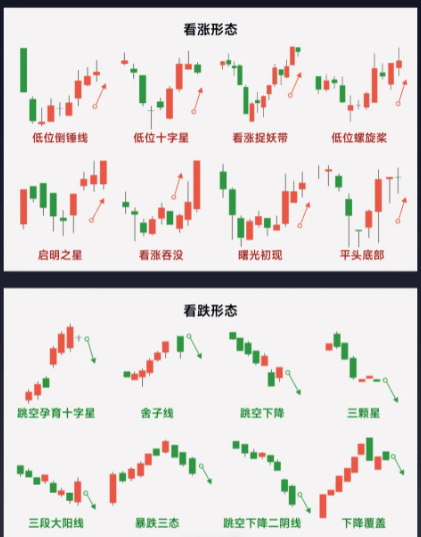
Advanced bullish and bearish patterns:
Bullish patterns: Inverted hammer at low, doji at low, bullish engulfing, morning star, etc.
Bearish patterns: Gap down doji, shooting star, three stars, three consecutive large bearish candles, etc.
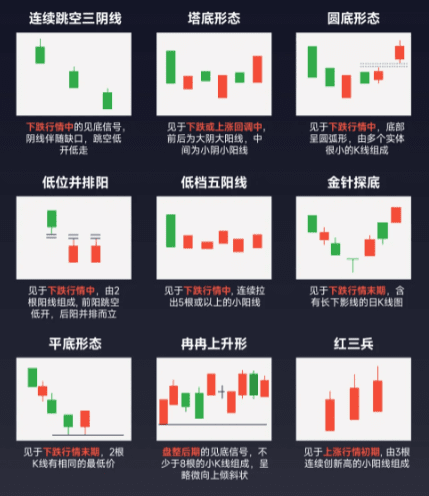
Classic bottoming patterns:
Three consecutive gap down bearish candles, tower bottom pattern, rounded bottom pattern, low parallel bullish, low five bullish candles, golden needle probing bottom, flat bottom pattern, rising shape, three red soldiers.
If you can understand all the candlesticks, then you will definitely achieve the results you want in this cryptocurrency space.
Teaching someone to fish is better than giving them fish.
Whether you are a beginner or an expert in the cryptocurrency space, what you gain from me is not just financial returns, but also growth in investment knowledge and experience.
In the investment process of all loyal fans, we will not only provide investors with analysis ideas of the market, basic knowledge of market observation, and usage methods of various investment tools, but also bring exciting fundamental interpretations, sorting out the chaotic international situation, and identifying various investment forces.
Let you become both a winner and an expert in investing!


