1. Technical Analysis
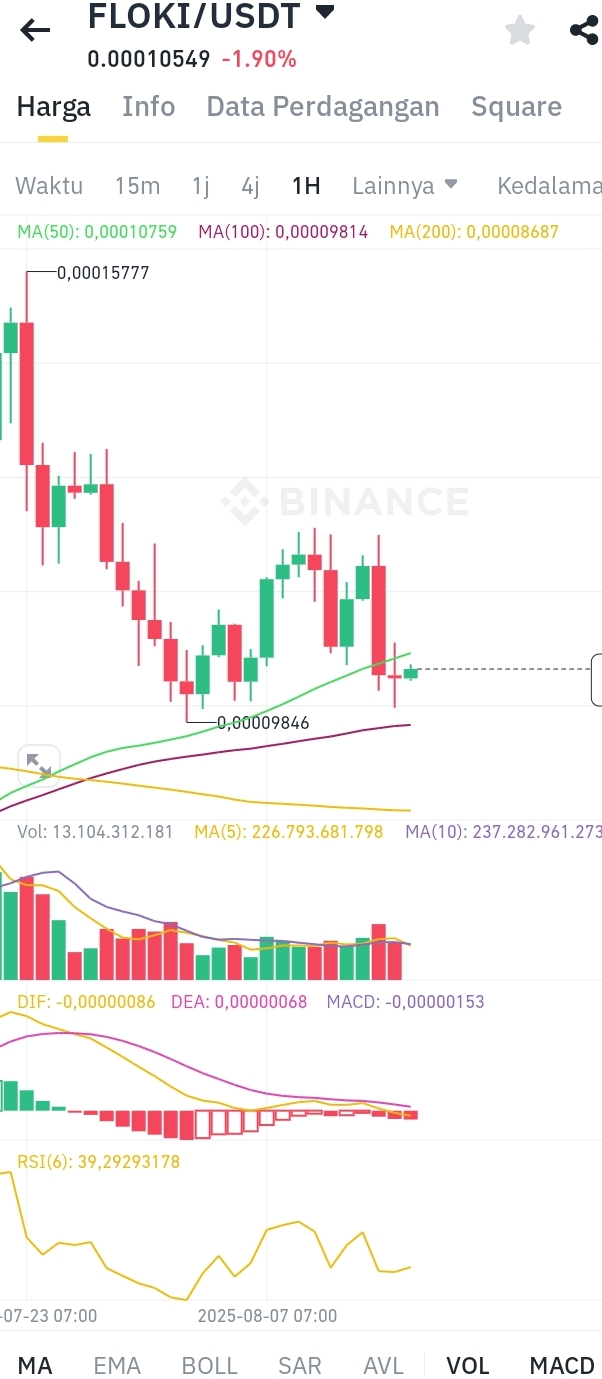
Current Price: 0.00010549 USDT (-1.90%)
Moving Averages (MA)
MA(50): 0.00010759 (Price below MA50 → short-term bearish)
MA(100): 0.00009814 (Price above MA100 → strong support)
MA(200): 0.00008687 (Price far above MA200 → long-term trend still bullish)
MACD Indicator:
MACD (-0.00000153): Bearish (MACD line below DEA signal)
RSI(6): 39.29 (Approaching oversold, rebound potential)
Volume:
24h Volume: 13.1B FLOKI (relatively low compared to MA5 & MA10 volume)
MA(5) Volume: 226.8B (Decreasing volume → lack of momentum)
2. Important Levels
Support:
0.00009846 (Binance lowest level)
0.00009814 (MA100)
Resistance:
0.00010759 (MA50)
0.00011567 (Binance highest level)
0.00016074 (Previous High)
3. Trading Strategy
A. Swing Trading Strategy (1-3 Days)
Buy Zone:
If the price approaches 0.00009846 (strong support) with rebound confirmation (RSI > 40 & volume increasing).
Target Profit: 0.00010759 (MA50) or 0.00011567.
Stop Loss: 0.00009500 (below last support).
Short Opportunity (if strong downward trend):
If the price fails to break MA50 (0.00010759) with RSI remaining below 50.
Target: 0.00009846.
Stop Loss: 0.00011000.
B. Scalping (5-15 Minutes)
Buy at Oversold RSI (30-40) with increasing volume.
Quick Sell at 0.00010700-0.00010800 (near MA50).
Use trailing stop if the price continues to rise.
C. Breakout Trading
If the price closes above MA50 (0.00010759) with high volume → BUY.
Target: 0.00011567.
Stop Loss: 0.00010400.
4. Risk Management
Use a minimum risk-reward ratio of 1:2.
Avoid large trades if volume is low (lack of liquidity).
Monitor FLOKI news & sentiment (meme coin very volatile).
5. Final Recommendation
Current: Price tends to be sideways-bearish, but there is potential for a rebound from MA100 support.
If Bitcoin drops, FLOKI could also correct deeper → wait for support confirmation.
If the bullish trend returns, a breakout of MA50 could be a strong signal for long.
🚀 Use this analysis in combination with price action & strict risk management.