Hello. That is an excellent question about the application of Japanese candlestick patterns.
Japanese candlestick patterns, like the ones shown in the image, cannot be implemented on 1-minute charts and expected to be accurate for prediction. Accuracy in trading does not exist, as everything is based on probabilities.
Accuracy in 1-Minute Charts
1-minute charts are extremely volatile and are filled with what is known as 'market noise.' This noise consists of random movements and false signals that do not reflect the true direction of the market. For this reason:
1_ Higher number of false signals: On a 1-minute chart, patterns are constantly forming and breaking, leading to a large number of false signals that can result in losses.
2_ Lower reliability: The reliability of a candlestick pattern increases with the time frame in which it forms. A hammer on a weekly chart carries much more weight and is a much stronger signal than a hammer on a 1-minute chart. Professional traders often use 4-hour, daily, or weekly time frames to make important decisions, as they reflect a more consolidated and reliable trend.
In summary, using these patterns on a 1-minute chart is like trying to predict the weather for an entire day by looking at the movement of a leaf.
Probability is Key
No candlestick pattern or technical analysis tool has a fixed and guaranteed accuracy percentage. Trading is not an exact science, but a game of probabilities.
1_ There is no 'accuracy percentage': There is no exact data that states 'a hammer pattern is accurate 70% of the time.' Its effectiveness depends on multiple factors, such as market context (whether it is in a bullish, bearish, or sideways trend), trading volume, and whether the pattern forms at a significant support or resistance level.
2_ Increasing probabilities: The purpose of candlestick patterns and any technical analysis is to increase the likelihood that a trade will be successful. For example, if a 'hammer' pattern appears on a daily chart right at a strong support level, the probability that the price will rise is significantly greater than if it appears anywhere else.
In conclusion, candlestick patterns are a valuable tool, but their power lies in using them on larger time frames and in combination with other elements of technical analysis, not as an infallible rule on very short-term charts.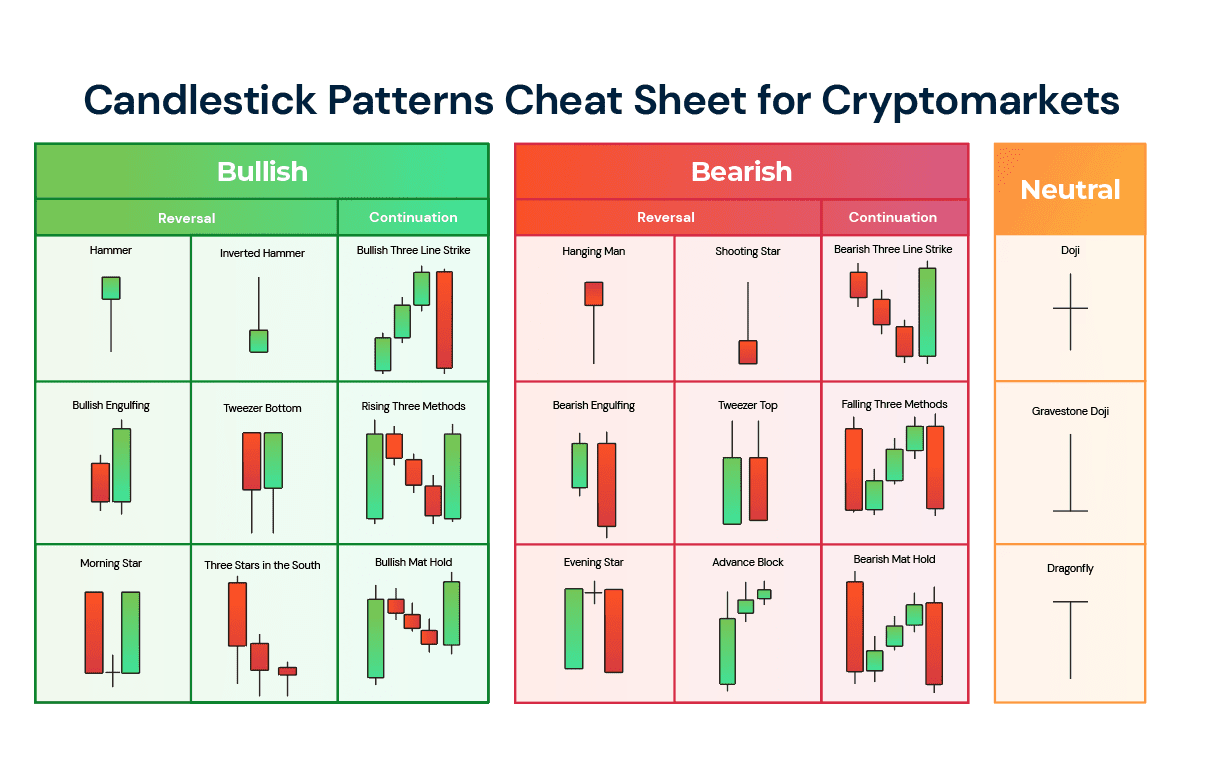 #BinanceAlphaAlert #DeFiGetsGraded $BTC