📈 Latest price: Bitcoin reached an all-time high of $124.4K, but the movement was very brief due to selling pressure.
⚠️ Bull Trap: Late buyers fell into the trap after the rapid rise, and then the price quickly retraced.
🔹 Current range: Bitcoin is currently trading between $116K and $124K, and short-term movements are expected to remain volatile until this range is clearly broken.
📊 Technical analysis
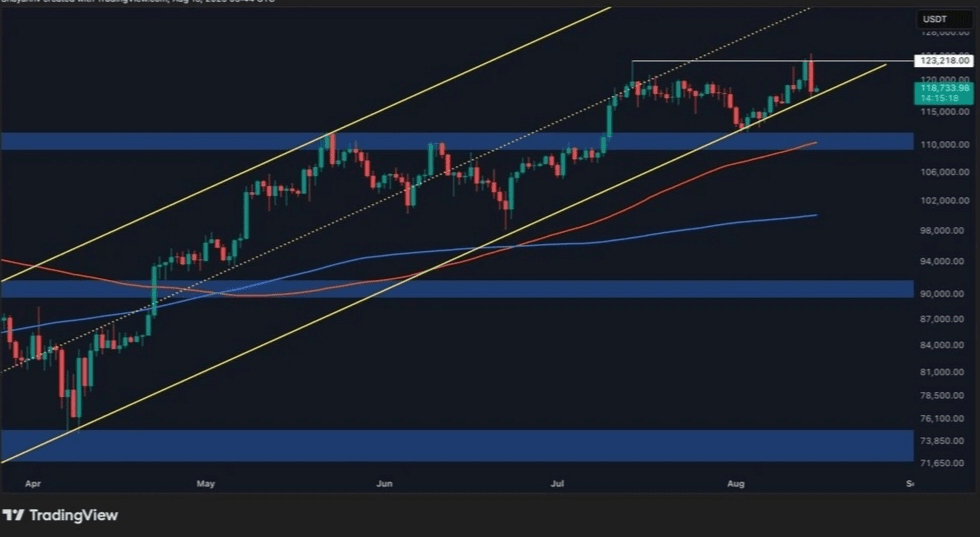
On the daily chart, the price returned towards an important support level at $118K, which is a critical level for determining the continuation of the long-term bullish trend.
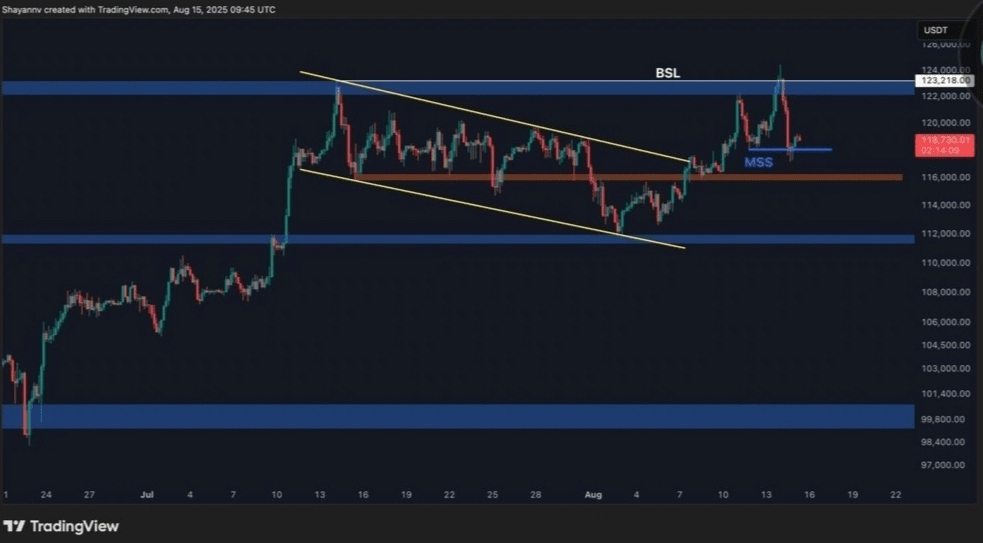
On the four-hour chart, BSL (liquidity hunt) occurred where the high was broken and then retraced, signaling a possible change in market structure.
🌐 On-chain analysis
Sharp rise in Binance Mean Inflow, indicating a large amount of Bitcoin entering the platform, often in preparation for sale or portfolio rebalancing.
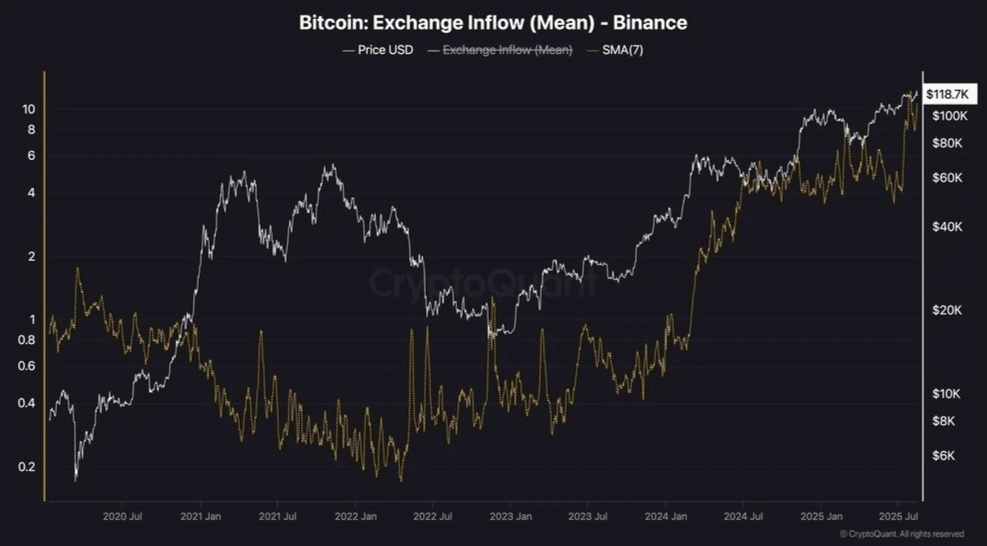
Net increase in inflows (inflows > outflows), which may create short-term volatility if not accompanied by sufficient buying demand.
💡 Summary:
The market shows signs of a bull trap, and trading is near the current range limits. Upcoming movements depend on support at $118K or breaking the current range.