Ethereum (ETH) has adjusted down nearly 1% in the past 24 hours, briefly falling below $4,500 before bouncing back and trading above $4,600. This decline occurs amid a broader crypto market downturn, wiping out over $240 billion in market capitalization and triggering nearly $1 billion in liquidations.
However, despite strong selling pressure, on-chain signals and technical analysis of ETH indicate that the bulls still have the advantage.
The second-highest inflow to exchanges this year signals selling pressure.
On August 14, Ethereum recorded 2,594,168 ETH transferred to exchanges, marking the second-highest net sending amount of the year 2025, only behind the peak of 3,264,688 ETH on February 3.
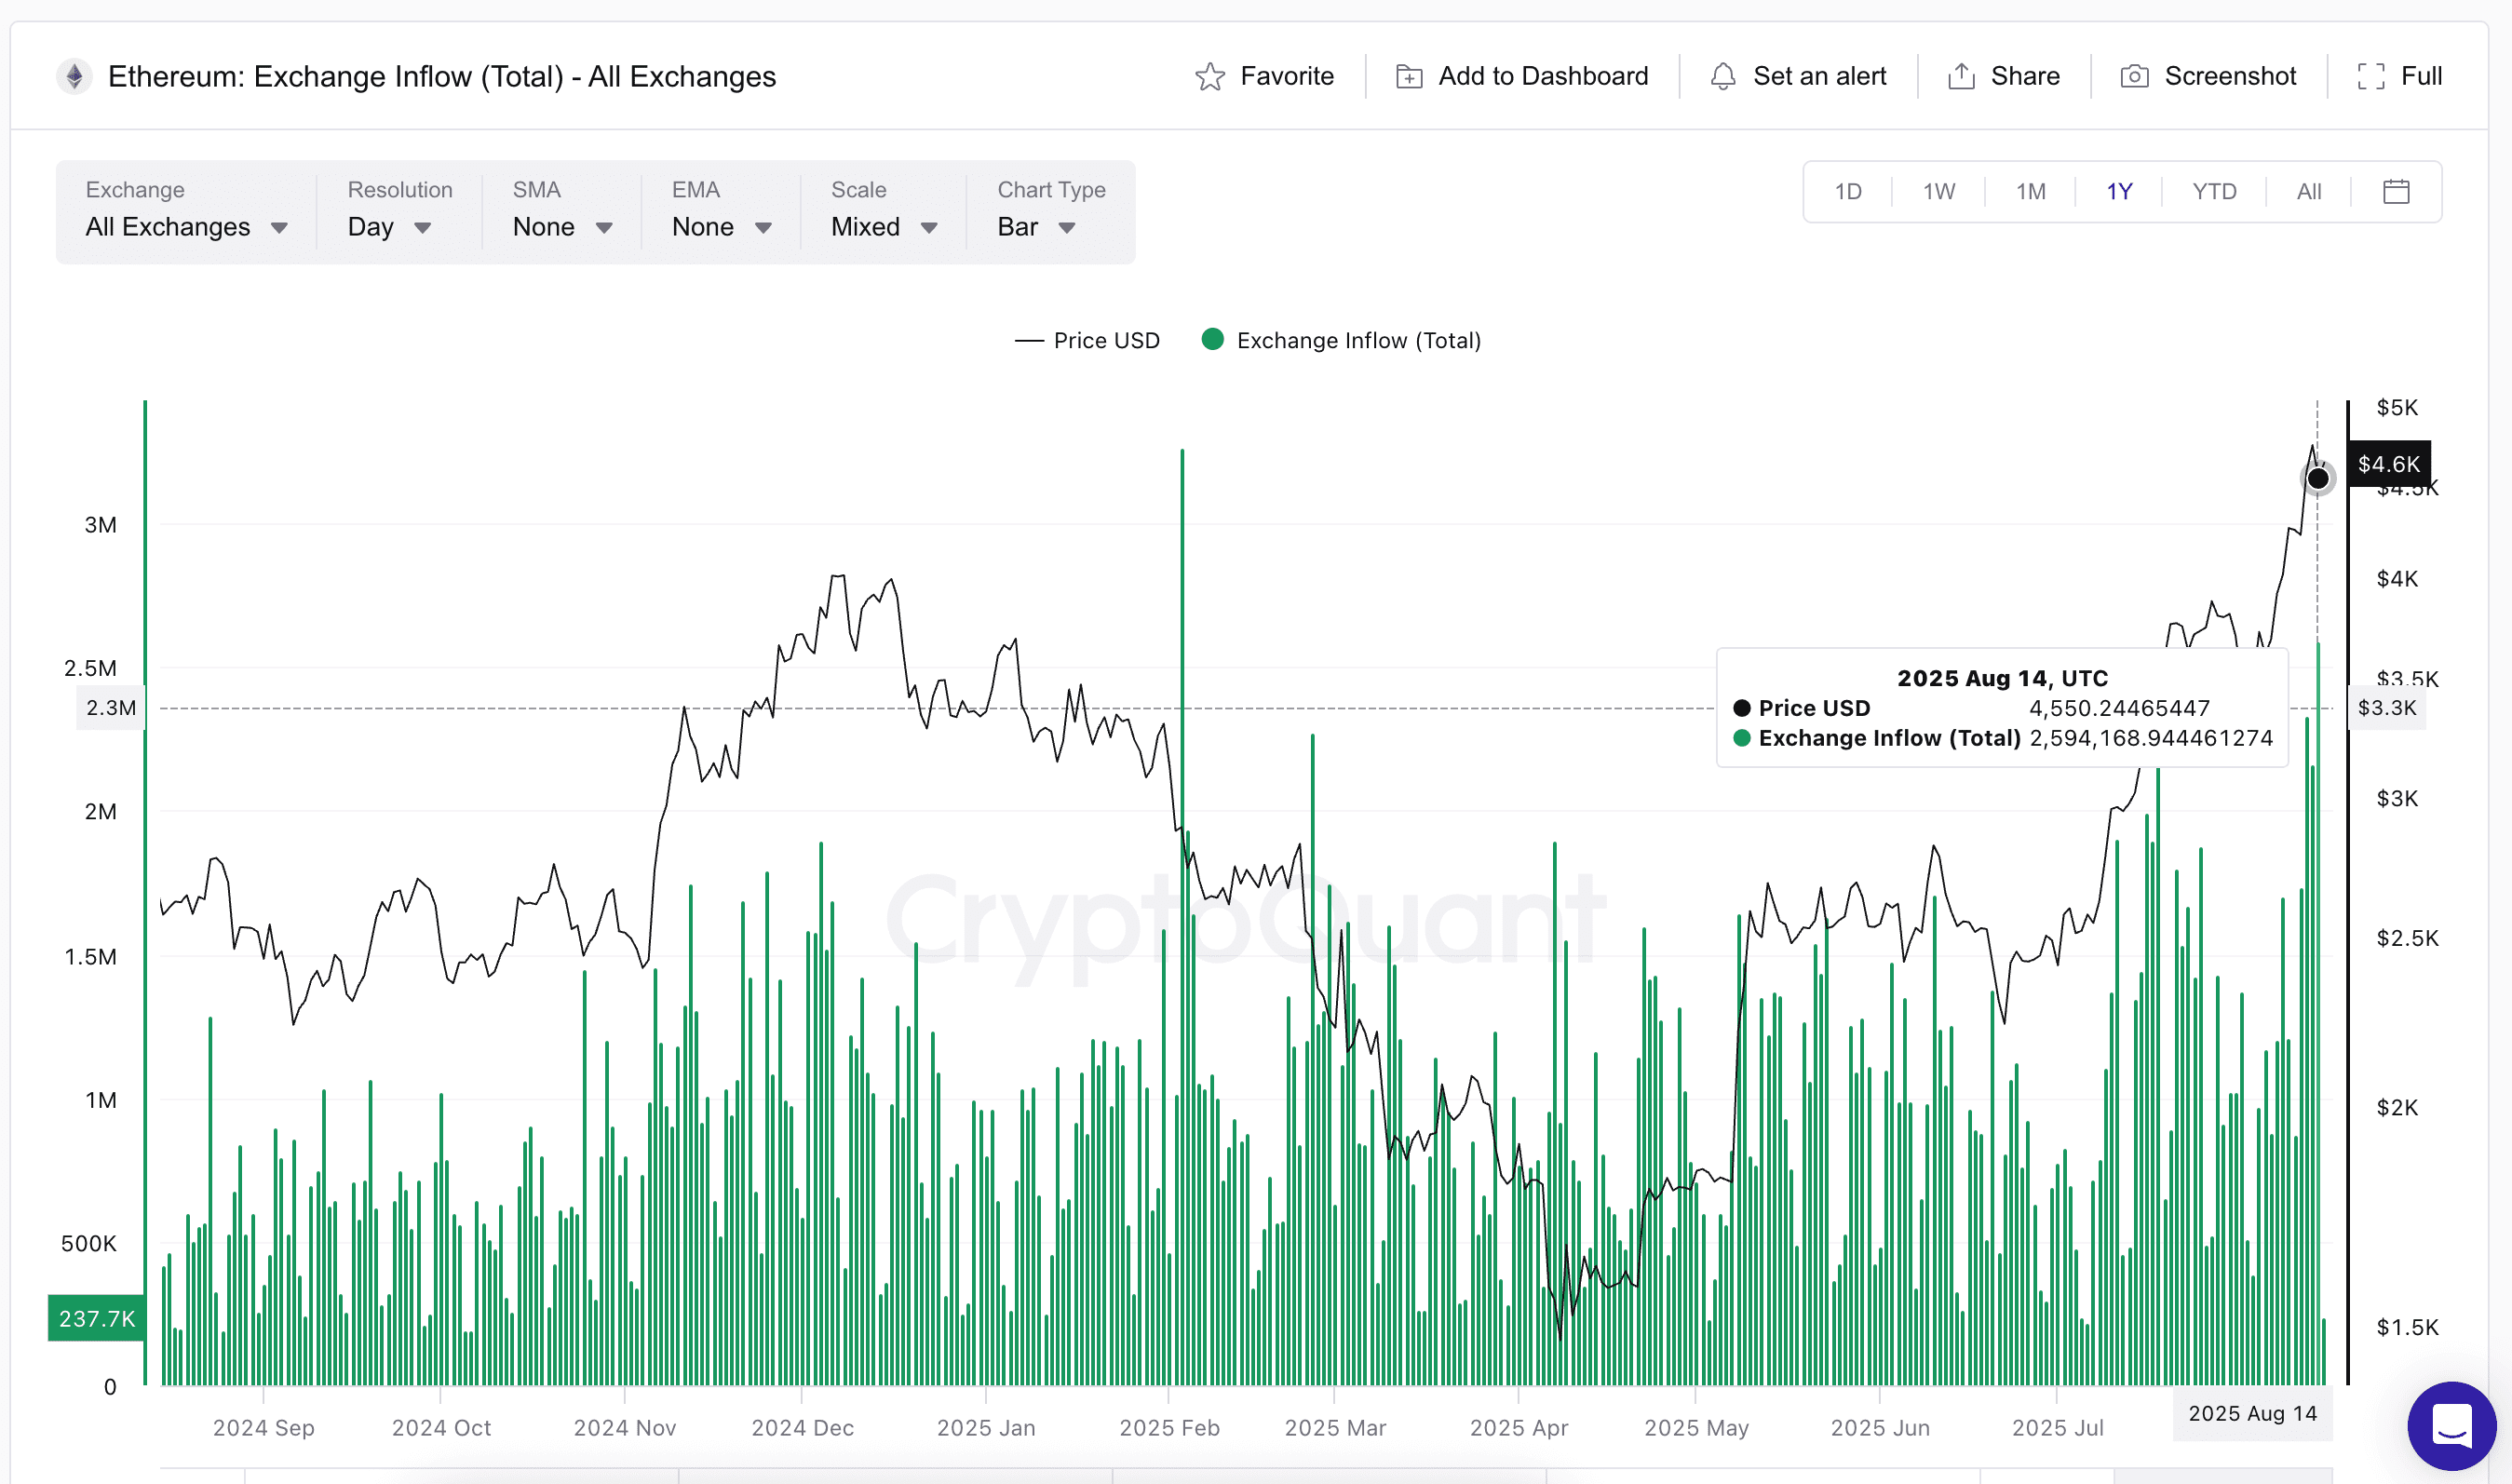
Inflow to exchanges is often a signal for potential selling pressure, and this strong surge partly comes from the wallets of the Ethereum Foundation — the largest sellers recently.
Historically, local peaks of inflows to exchanges at high levels often lead to price corrections, as seen in early 2025. At that time, the price of ETH was in a downtrend, and each local peak of inflows to exchanges was followed by a deeper decline.
The current situation is different, as on July 18 (2,381,361 ETH) and August 12 (2,335,642 ETH) — two local peaks led by inflows to exchanges. Unlike the spikes in February during a downtrend, recent large inflows occurred while the market is in an uptrend, where selling pressure is offset by strong buying. This ability to absorb selling pressure is the key factor keeping the bullish structure of ETH intact.
Inflow from large holders shows buying power absorbing supply.
Support for the story of 'absorbing selling pressure', the inflow from large holders — holding at least 0.1% of the total ETH supply remains strong. Despite a slight decrease on August 13, the 7-day change is still +98.71% and in 90 days it has surged +255.27%. These wallets are known for strong accumulation when prices drop.
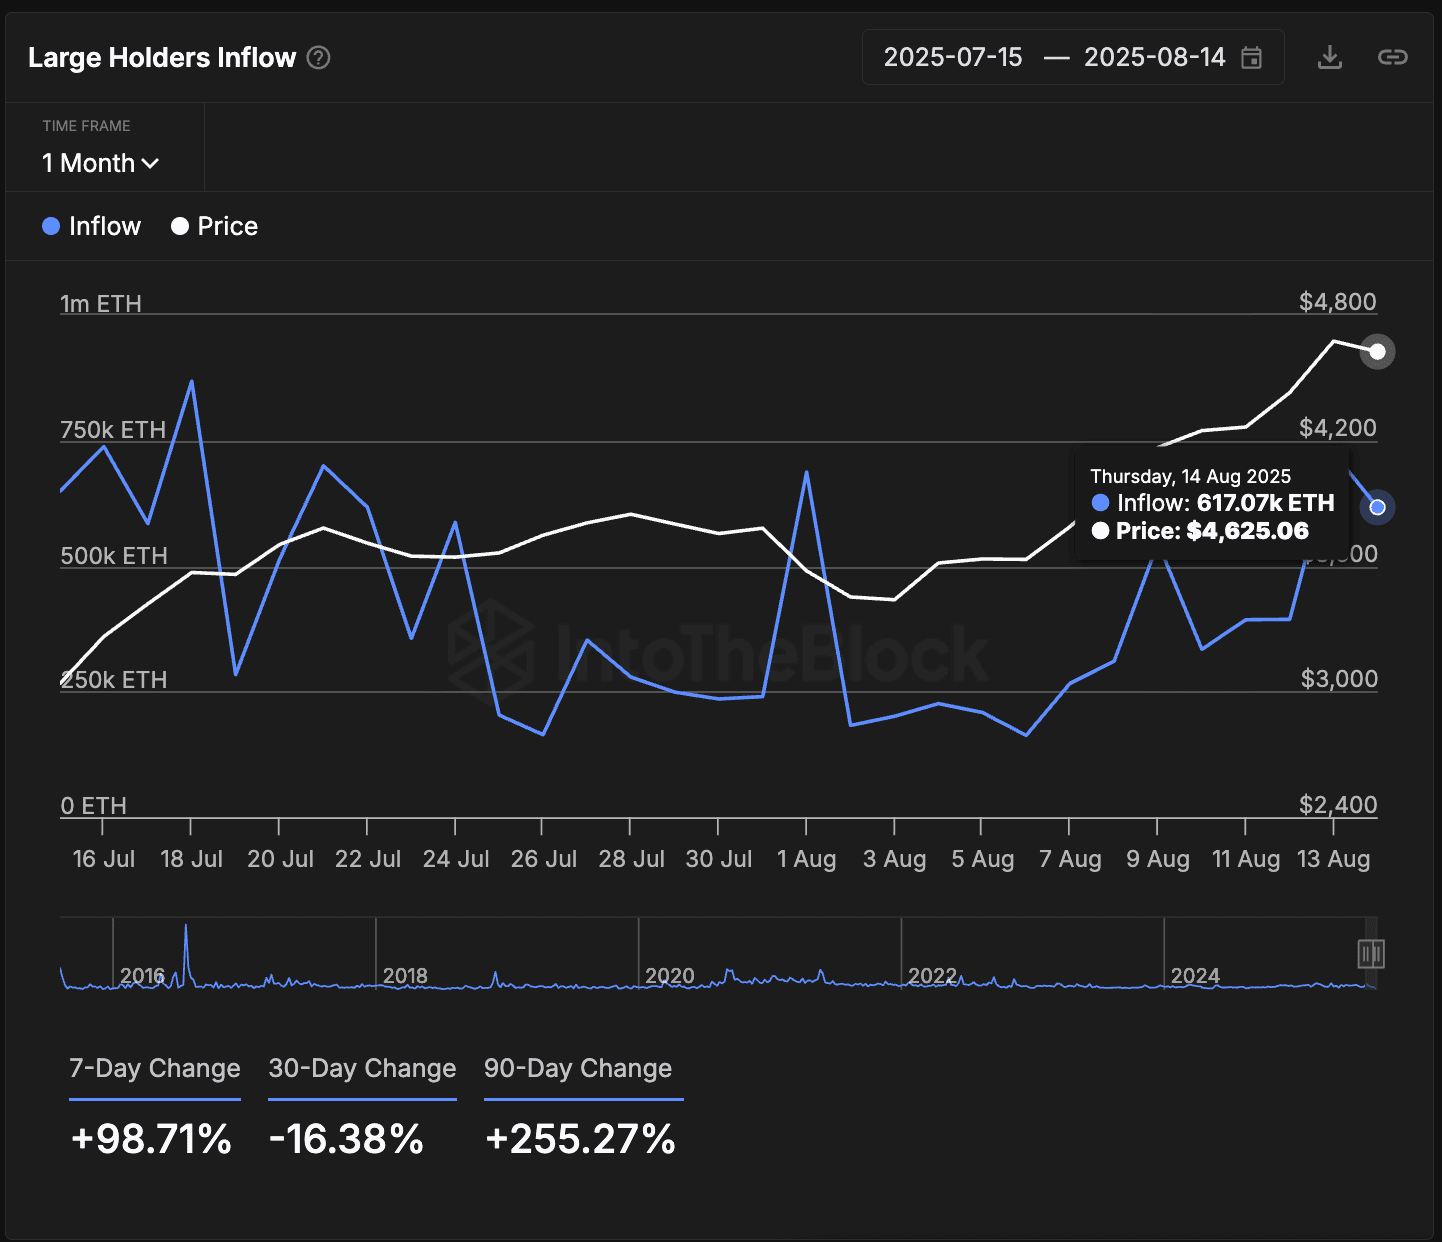
For example, from July 31 to August 1, when the price of ETH dropped from $3,781 to $3,577, the inflow from large holders surged from 240,190 to 687,290 ETH.
Even after short corrective movements, these inflows continue to set higher peaks on the monthly chart. The figure reached 725,000 ETH on August 13 before stabilizing above 617,000 ETH. This is a sign that wealthy investors are still continuing to build their positions.
Inflow to exchanges reflects the amount of coins transferred to trading platforms, often signaling potential selling pressure. Conversely, inflow from large holders measures the accumulation of wallets holding at least 0.1% of the total ETH supply — an indicator of buying power from the 'whales'.
The price structure of ETH remains intact as the bulls maintain control.
Technically, the price of ETH is still in an uptrend, with the $4,480 area serving as strong support during the recent decline. The nearest resistance is at $4,785 — an important Fibonacci extension level. If the price closes the day above this threshold, ETH could open up a rally towards the psychological level of $5,000, precisely $5,175.
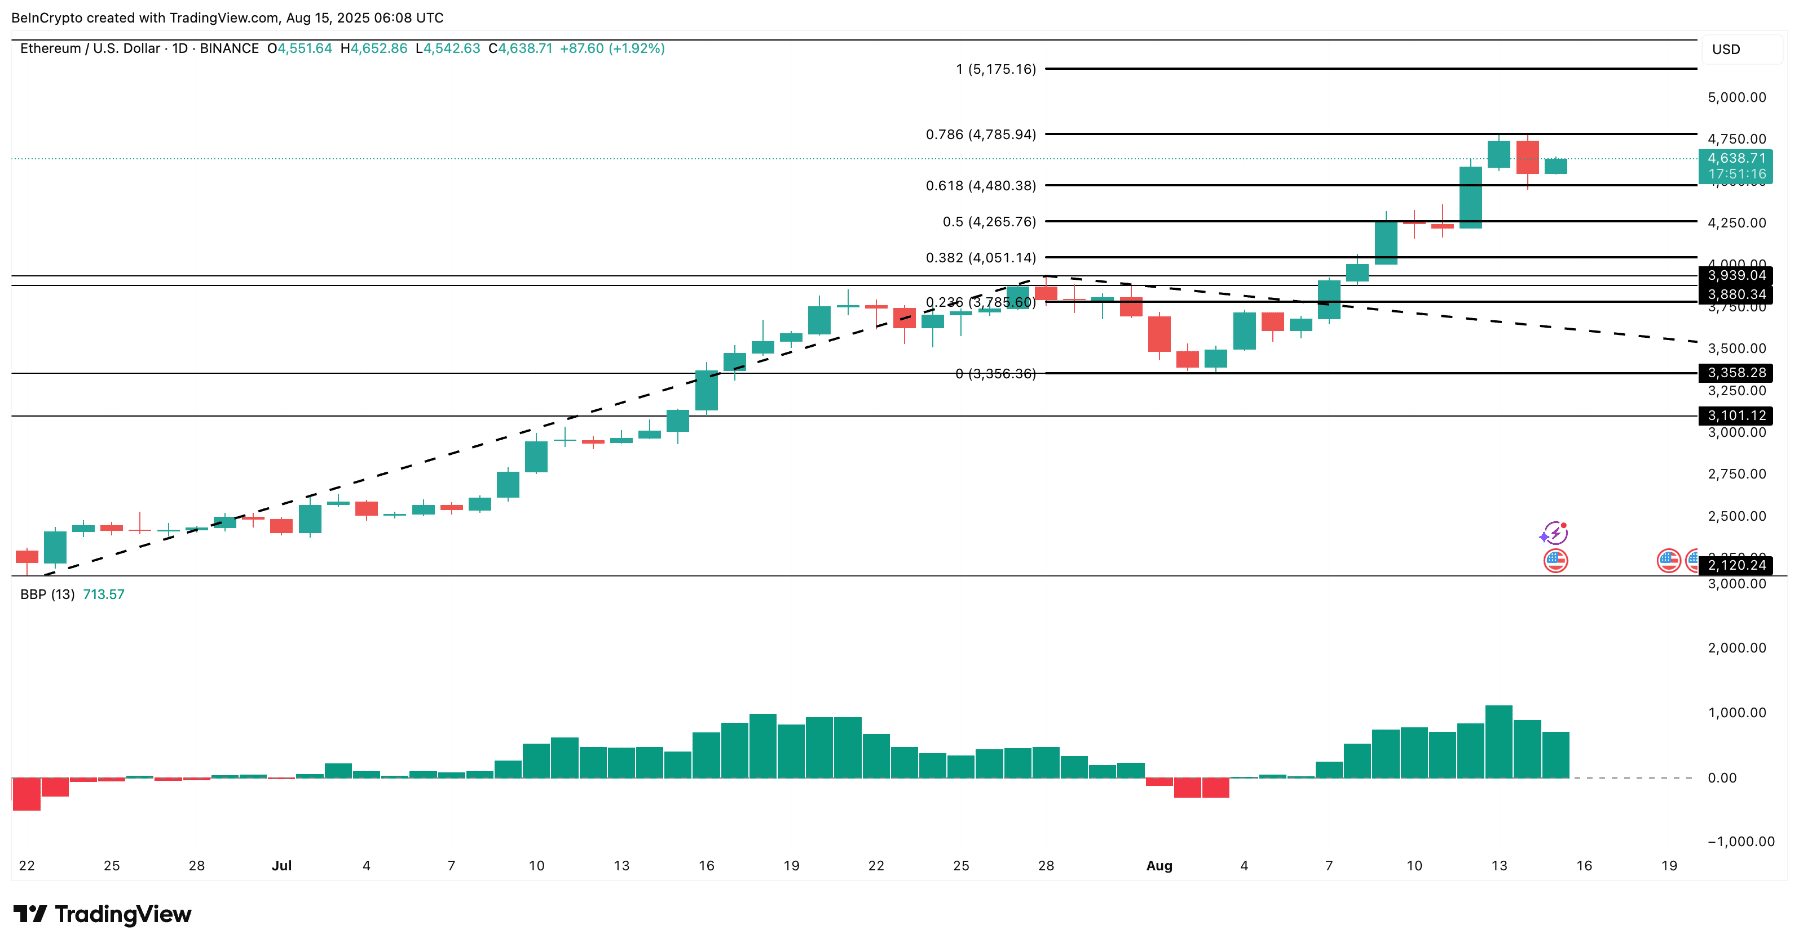
The bull-bear strength indicator continues to lean towards the bulls, indicating that despite the large inflow to exchanges, the bears have not yet gained control.
The bullish scenario will be invalidated if the price decisively breaks (completes a candle close) below $4,480, along with a continuous strong inflow to ETH exchanges and a decrease in inflow from large holders over 30 days. So far, these conditions have not yet occurred.
