

📊 Analysis of MDT/USDT: Possible reversal after a prolonged decline 🚀
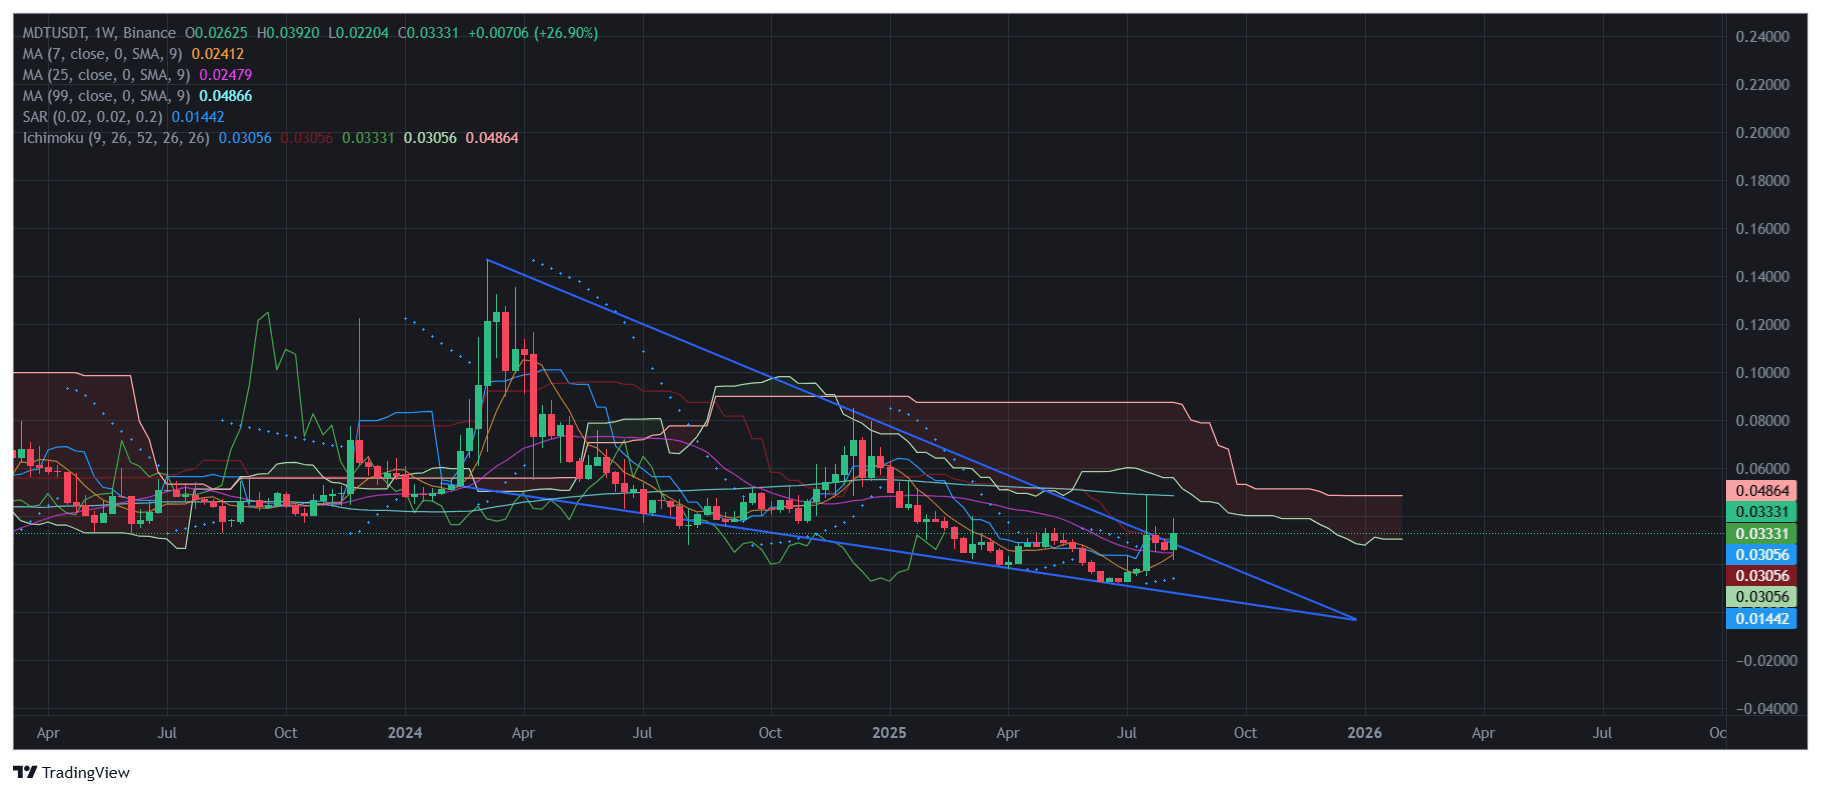
On the weekly chart of MDT/USDT, an interesting technical picture is observed. The price has been in a descending wedge for a long time 🔻, which is traditionally a bullish pattern upon a breakout.
💡 Key Observations:
Current price: $0.0333 — an increase of +26.9% over the week 📈.
SMA 7 and SMA 25 ($0.0241 and $0.0247) are below the price, confirming a short-term bullish momentum ✅.
SMA 99 ($0.0486) currently acts as medium-term resistance 🛑.
Ichimoku Cloud: The price is still below the cloud but is approaching a test of the lower boundary ($0.0335–0.0486). Breaking the cloud will confirm an upward trend ☁️➡️☀️.
Parabolic SAR ($0.0144) remains below the price, indicating an upward phase.
📌 Strong Levels:
Support: $0.0245 and $0.0300 🛡.
Resistance: $0.0486 and $0.0600 🎯.
📈 Potential Scenario:
If the price holds above $0.035 and breaks the area of $0.0486, acceleration to $0.06–0.07 is possible. A bounce from the current resistances back to $0.03–0.028 is also realistic.
⚠️ Risks:
The Ichimoku cloud is still bearish, and the overall market may affect MDT's dynamics. Without holding above $0.0486, the trend reversal is not confirmed.
💬 Conclusion: MDT shows the first signs of exiting a prolonged downward trend 📊. It is interesting for medium-term traders but requires confirmation by breaking key zones.
