A detailed short-term technical preview from Binance Squares gives us the following analysis:
Trend Indicators
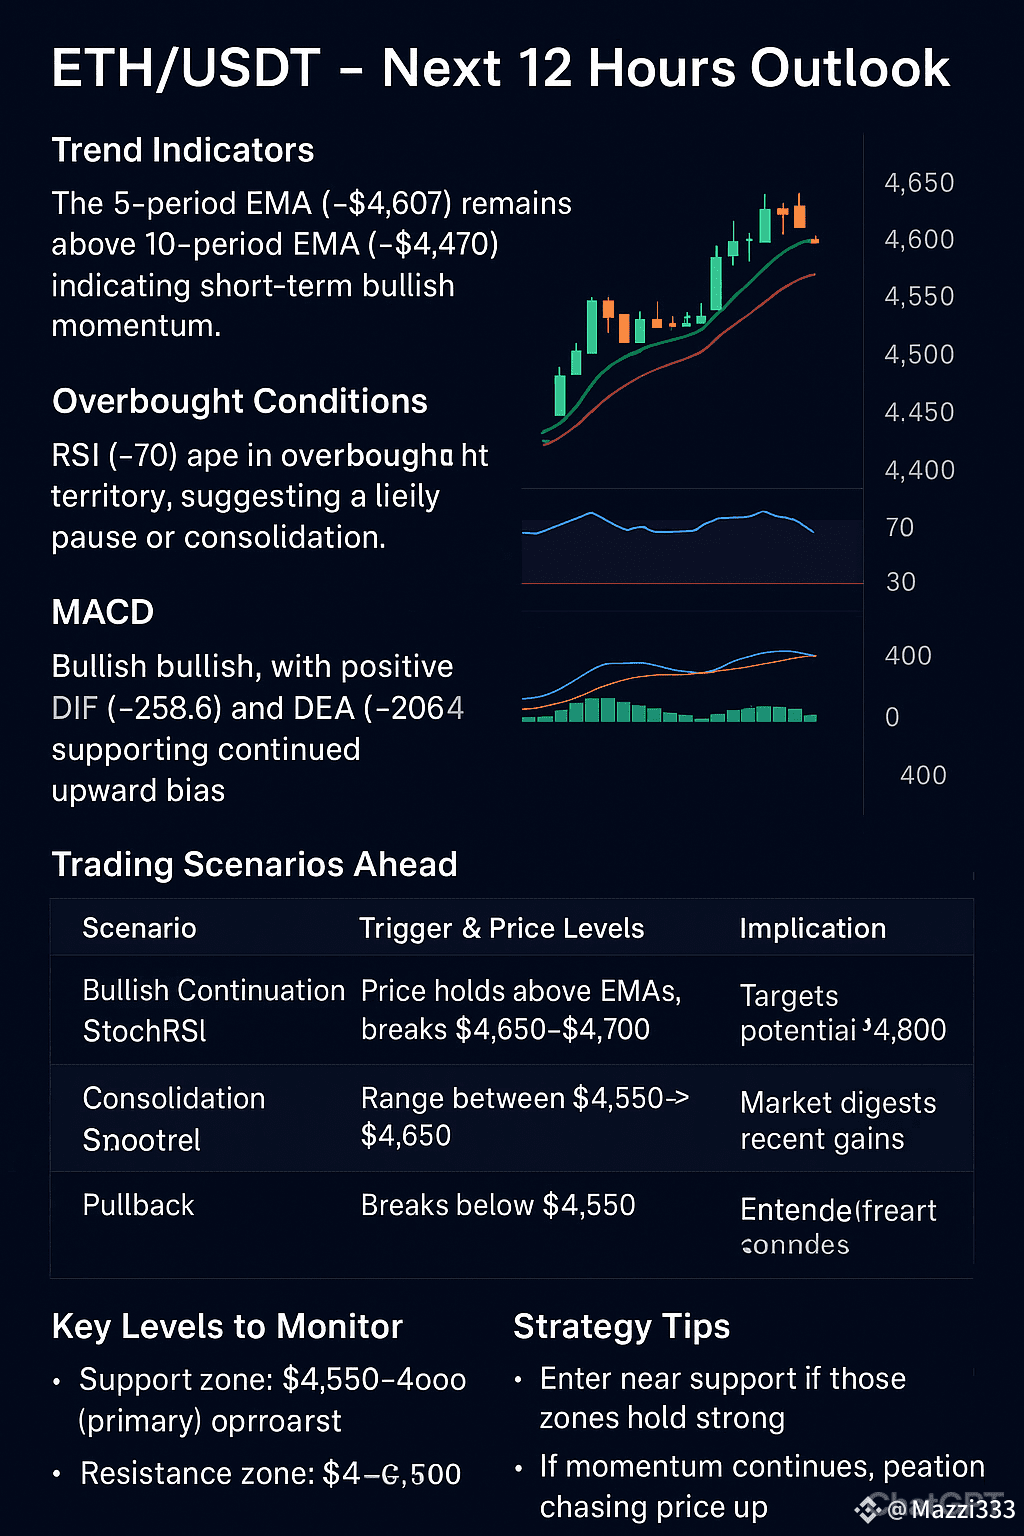
The 5-period EMA (~$4,607) remains above the 10-period EMA (~$4,470), indicating short-term bullish momentum .
Overbought Conditions
Both the RSI (~70) and StochRSI (>92) are in overbought territory, suggesting a likely pause or consolidation soon .
MACD
MACD remains bullish, with positive DIF (~258.6) and DEA (~206.4) values, supporting continued upward bias .
Trading Scenarios Ahead
Scenario Trigger & Price Levels Implication
Bullish Continuation Price holds above EMAs, breaks $4,650–$4,700 Targets potential continuation toward $4,800
Consolidation Range between $4,550–$4,650 Market digests recent gains—watch volume & candles
Pullback Breaks below $4,550 Potential drop back toward $4,500
Key Levels to Monitor
Support Zone: $4,550–$4,600 (primary); deeper support near $4,500
Resistance Zone: Immediate: $4,650–$4,700; extended bullish target: ~$4,800
Strategy Tips
Consider entering near support if those zones hold strong.
If momentum continues, a breakout above $4,700 could signal another leg up.
Given the overbought indicators, watching for a possible short‐term retracement is wise—don’t chase higher without confirmation.
Broader Context
Recent institutional momentum—including a reported $500M ETF inflow on August 12, 2025—boosts the overall market sentiment and adds to bullish bias .
Analysts eye continuation toward higher targets (e.g., ~$5,241) based on MVRV bands .
---
TL;DR
Momentum remains positive, backed by EMA crossover and MACD.
Overbought indicators (RSI & StochRSI) suggest caution—consolidation or minor pullback is possible.
Support to watch: $4,550–$4,600; Resistance to break: $4,650–$4,700; Bullish target: ~$4,800.
Strategy: Prefer scaling in near support and wait for breakout confirmation rather than chasing price.
