Bitcoin reached a historical high of 125000, and I knew there would be a spike and then a pullback. I mentioned in the group that there would be a short-term retracement, coupled with the evening PPI data being higher than expected, leading to a significant price drop!
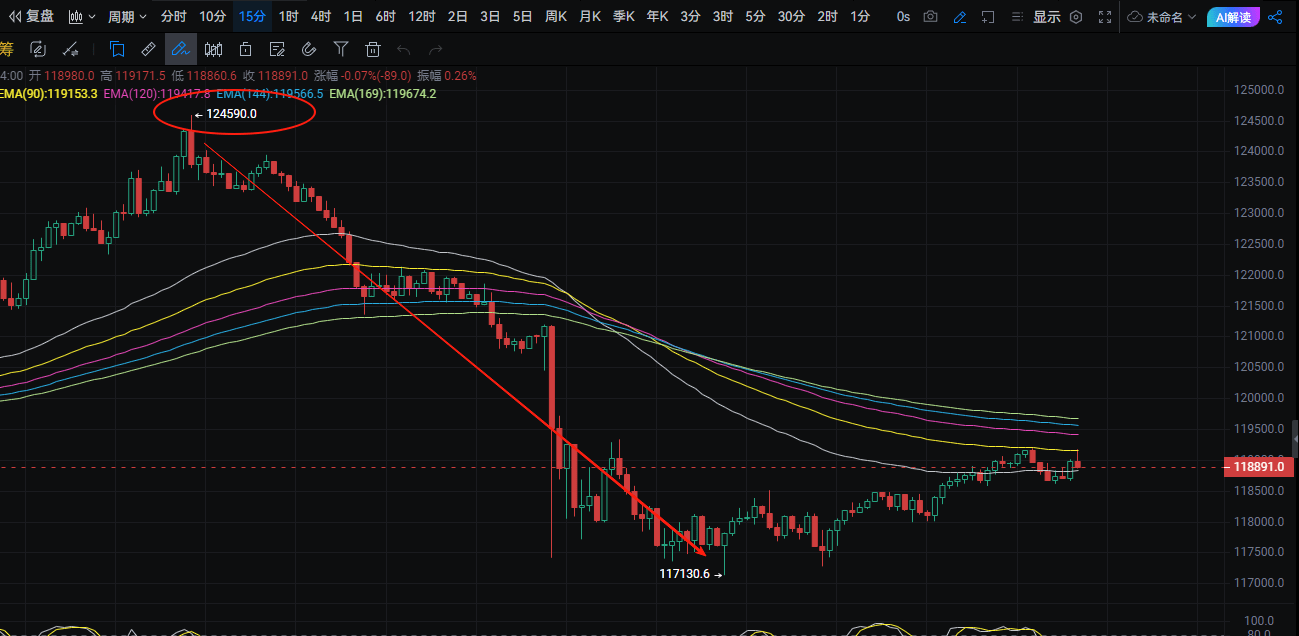
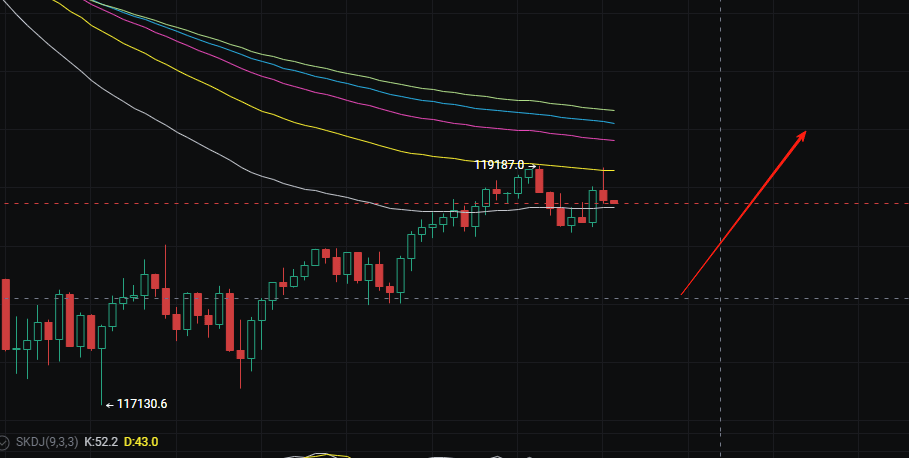
The Bitcoin daily chart has formed a bearish engulfing candlestick pattern, with the lowest point around 117000, returning to the previous starting point! The first short-term support reference is around 118200, and there is a high probability of a rebound repair at this position. A fluctuation of 200 points can be considered!
The second support is still around 116000 as I mentioned before, which is the platform support level aside from 111800. This time Bitcoin dropped 6% without touching it; if it really comes down, it’s worth a try!
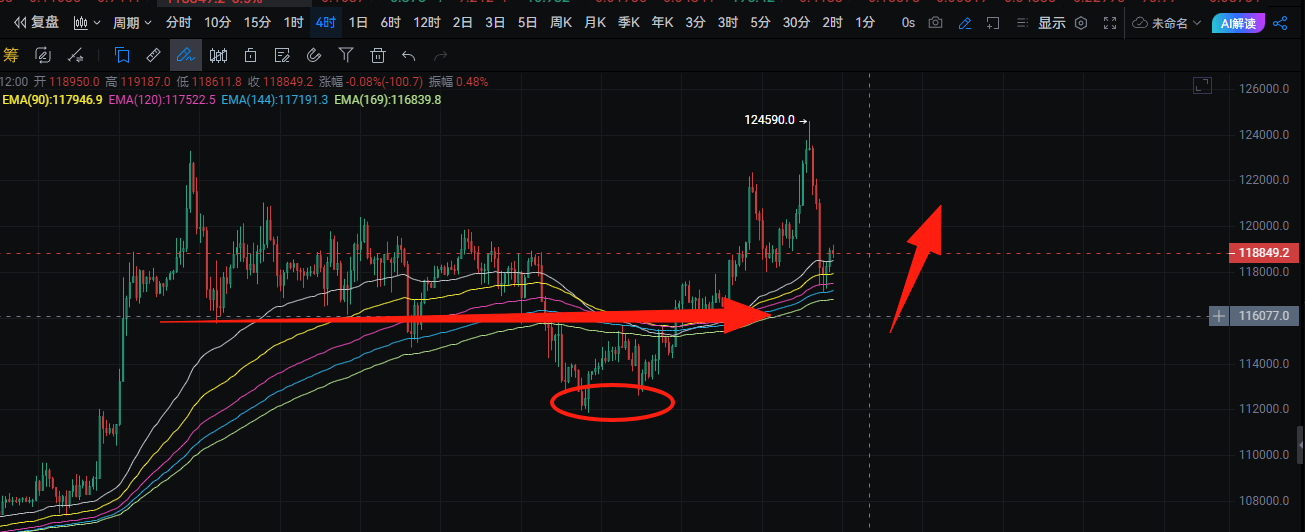
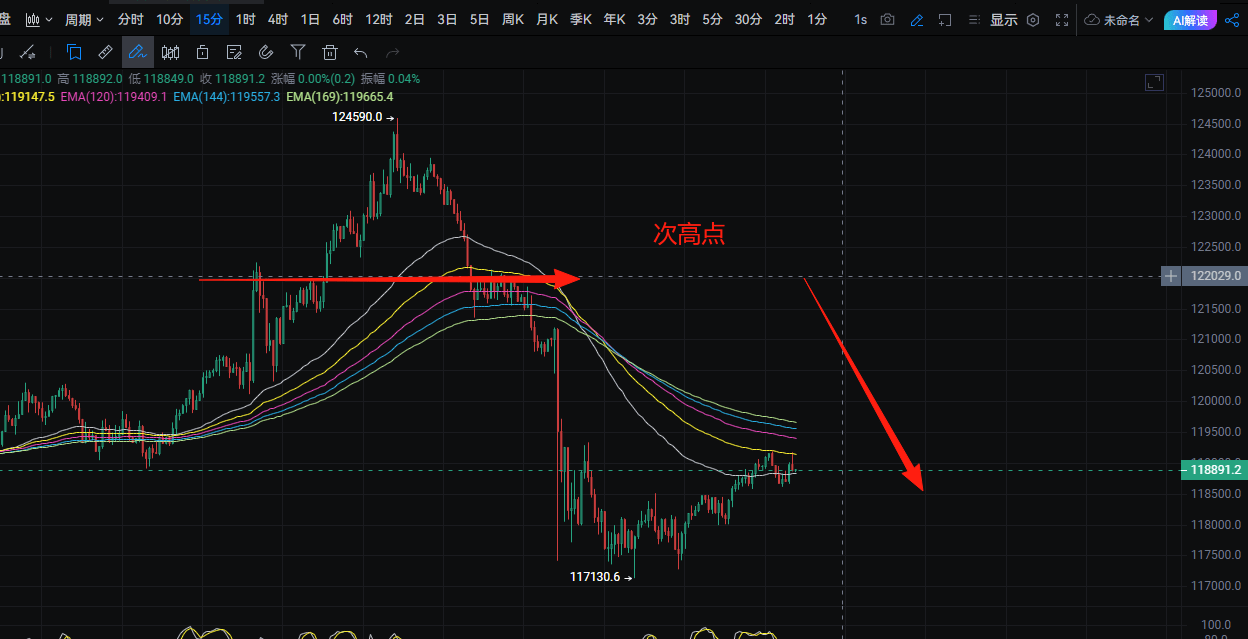
The upper pressure is still around 122000. Even though there was a significant drop last night, the ETF is still net inflowing. Institutions tend to buy more as prices drop, so recovering the decline is not impossible. A fluctuation of 200 points can be considered 🈳!
If you truly want to learn something from a blogger, you need to follow them continuously, rather than jumping to conclusions after seeing a few market movements. This market is filled with performers; today they show a long position screenshot, and tomorrow they summarize a short position, making it seem like they are 'always catching tops and bottoms.' In reality, it's all hindsight. A truly worthwhile blogger will have a trading logic that is consistent, self-consistent, and withstands scrutiny, rather than only jumping in when the market moves. Don’t be blinded by exaggerated data and out-of-context screenshots; long-term observation and deep understanding are necessary to discern who the thinkers are and who the dream makers are!
Personal opinion for your reference! SKL GTC MYX BNB


