

In this detailed market breakdown, we will analyze $C /USDT from both a trading and technical perspective, highlighting optimal entry/exit zones, trend momentum, and possible future price scenarios. This expanded analysis is designed to give traders actionable insights while reducing unnecessary guesswork.
1. Trade Signal Overview
Signal Type: Short (Sell Bias)
Entry Price Range: $0.2369 – $0.2475
Take-Profit Targets:
TP1: $0.2223 (Immediate support level)
TP2: $0.2190 (Major support zone)
Stop Loss: $0.2618 (Above strong resistance)
Risk–Reward Ratio: 1:2 (Favorable for swing traders)
Rationale for Short Setup:
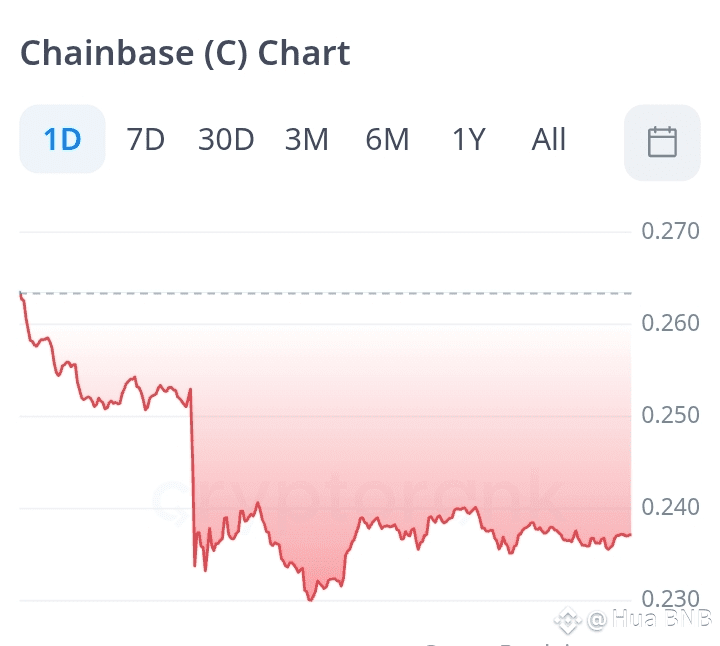
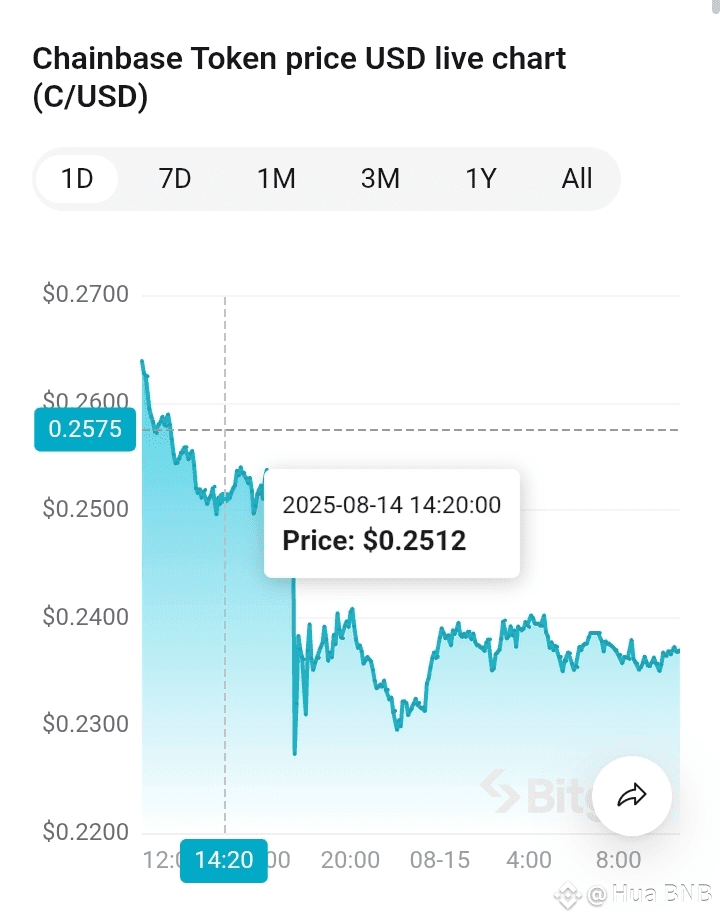
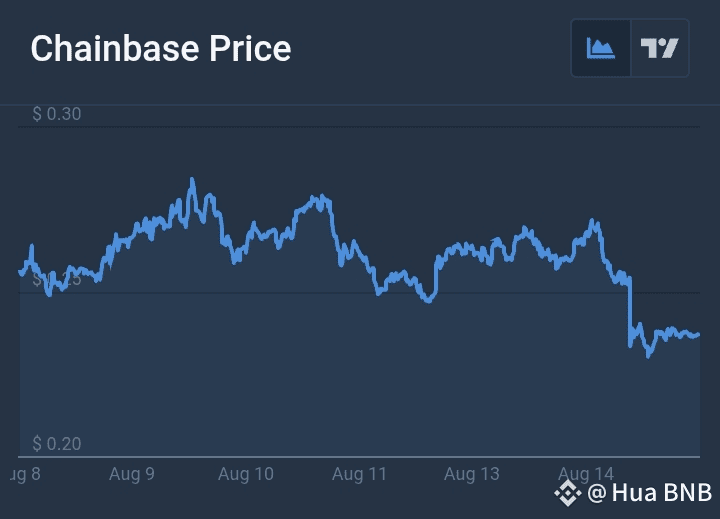
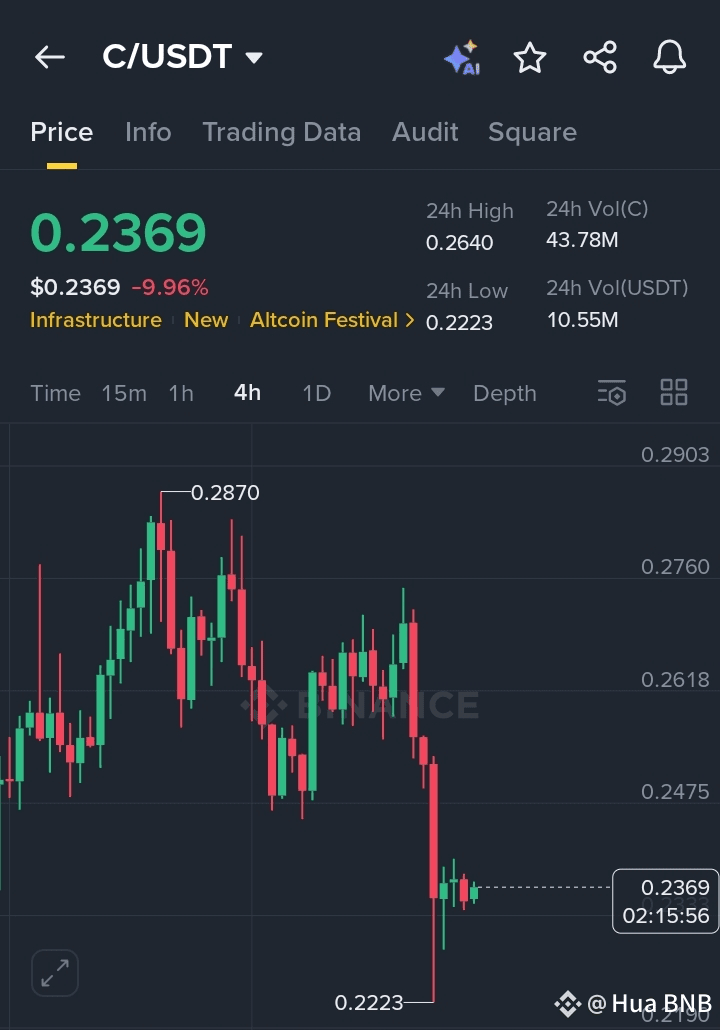
The price is in a confirmed downtrend, declining nearly 10% in the last 24 hours. It recently failed to sustain above the $0.2640 resistance, which is now acting as a ceiling for any upward moves. The market structure suggests sellers are likely to test lower supports before any potential reversal.
2. Technical Analysis Breakdown
A. Price Trend & Momentum
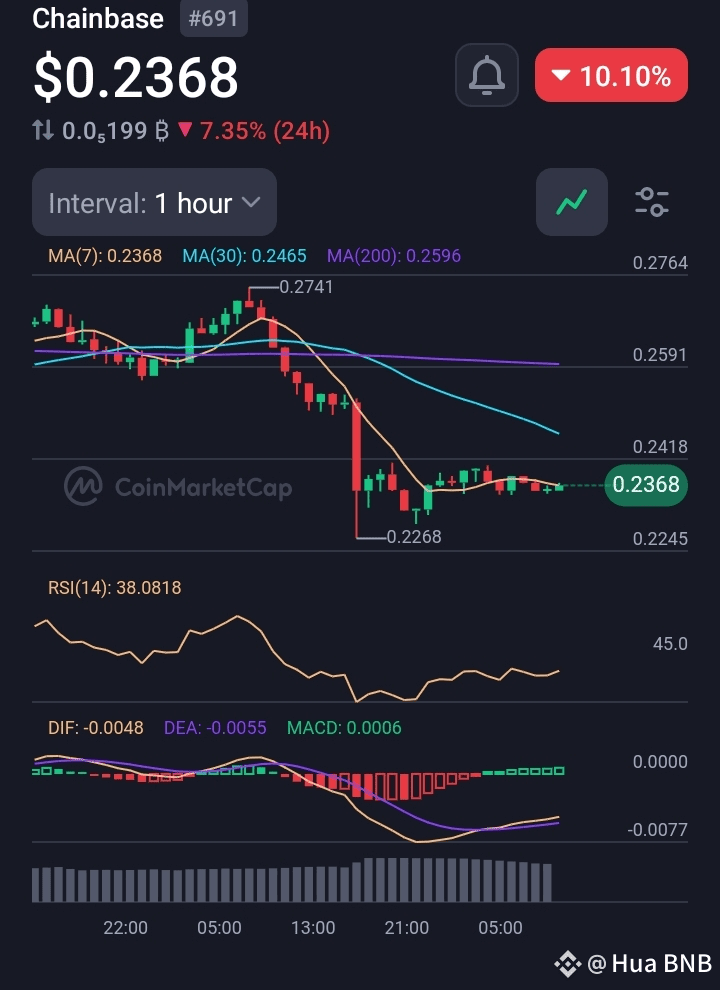
Current Price: $0.2369 (Down 9.96% in 24h)
24h Range: $0.2223 – $0.2640, reflecting strong intraday swings.
Trend Direction: Price action remains below key short-term levels, keeping the bearish sentiment intact.
If the market stays under $0.2475, selling pressure is likely to dominate.
B. Support & Resistance Levels
Support Zones:
$0.2223: First line of defense for bulls.
$0.2190: Stronger historical support.
Resistance Zones:
$0.2475: Closest barrier to bullish recovery.
$0.2618 – $0.2640: Key rejection area that recently capped upward movement.
C. Volume Analysis
24h Volume (C): 43.78M — selling orders dominate.
24h Volume (USDT): 10.55M — liquidity is pooling near the lower support levels.
A decisive breakdown below $0.2369 with heavy volume will confirm bearish continuation.
D. Indicators & Chart Patterns
Market Structure: Lower highs and lower lows confirm the downtrend.
RSI: Likely positioned under the 50 mark, indicating bearish momentum without reaching oversold extremes yet.
MACD: Risk of bearish crossover if the price continues to struggle under $0.2475.
3. Future Price Outlook
A. Bearish Scenario (Higher Probability — 70%)
If the price breaches $0.2223 with volume confirmation, a slide toward $0.2190 becomes highly probable. Failure to hold this zone could open the door to a drop toward the psychological $0.2000 mark.
B. Bullish Reversal Scenario (Lower Probability — 30%)
For a bullish recovery, C/USDT must reclaim $0.2475 and sustain above it. In this case, a short-term bounce toward $0.2618 is possible, with a stronger breakout above $0.2640 potentially invalidating the bearish structure.
4. Key Market Factors to Watch
Market Sentiment: Upcoming events in the altcoin space could inject sudden volatility.
Bitcoin’s Price Action: A sharp BTC drop could drag C/USDT lower.
Volume Surges: An abrupt spike in buying volume may hint at a reversal attempt.
5. Strategic Trade Plan
Primary Strategy: Short below $0.2369.
Stop Loss: Place above $0.2618 to avoid false breakouts.
Profit Booking: TP1 at $0.2223, TP2 at $0.2190.
Reversal Watch: Only consider long positions if the price closes above $0.2475 with strong buying volume.
6. Conclusion
At present, the technical picture for C/USDT favors sellers, with multiple indicators aligning toward a bearish bias. A breakdown below the immediate support could intensify the selling wave, while any bullish recovery attempt faces significant resistance overhead. Traders should remain disciplined with risk management and avoid chasing trades without confirmation.
#Chainbase @Chainbase Official $C
