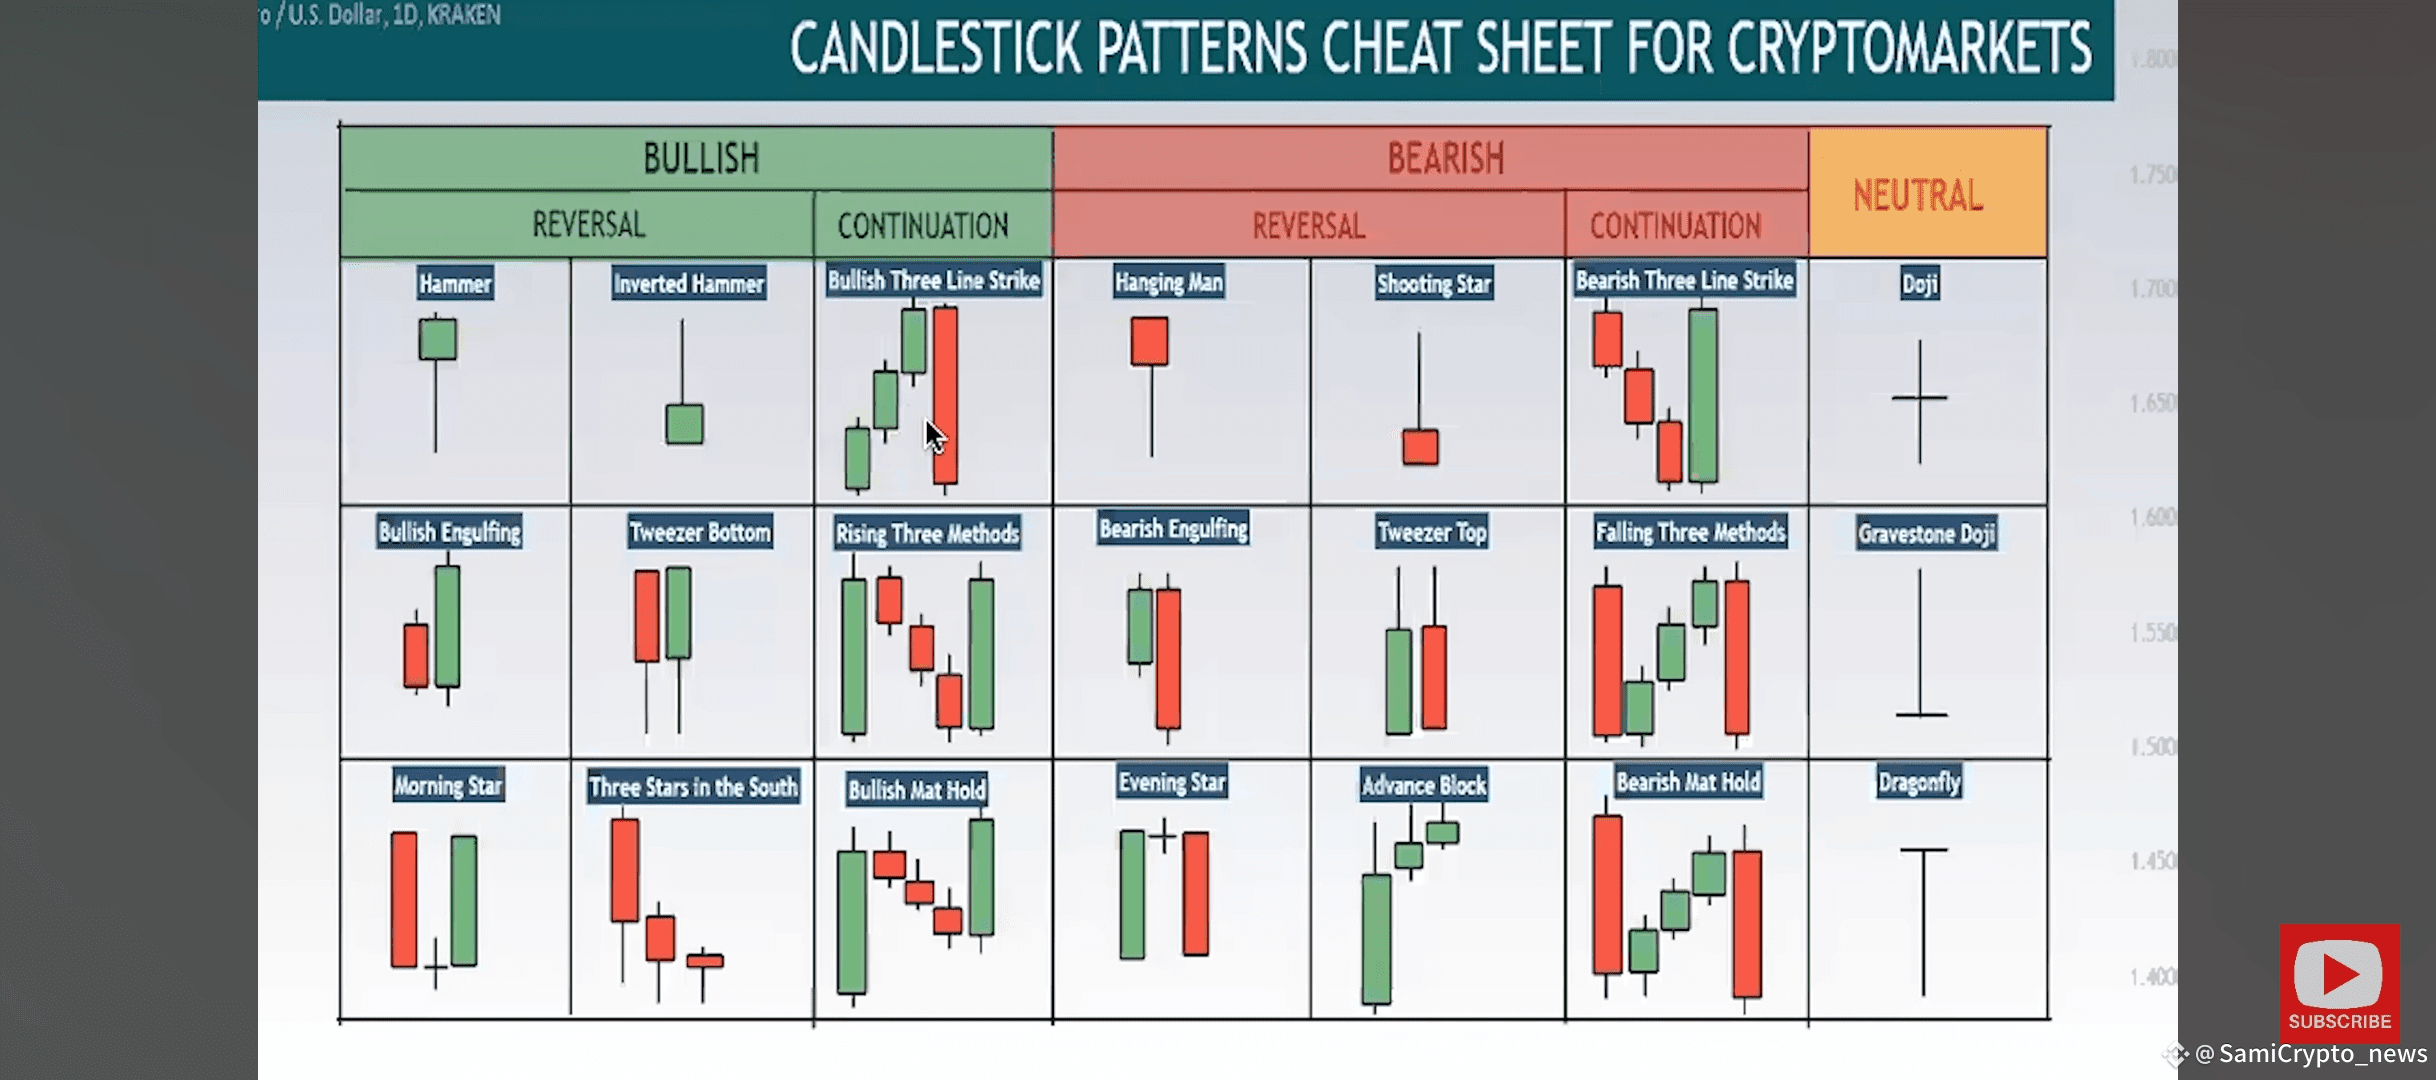
Cryptocurrency markets are driven by human psychology, and price charts are a visual representation of that psychology in action. Chart patterns reveal the market’s structure, signaling potential breakouts, reversals, or continuations. Candlesticks, on the other hand, provide a granular view of price action, offering insights into buyer and seller behavior over specific timeframes. Together, they form a dynamic duo that can help you time entries and exits with precision—an essential skill for growing a small account where every dollar counts.Unlike traditional markets, crypto trades 24/7, amplifying volatility and creating unique opportunities. For small account holders, this means you can capitalize on short-term price movements without needing massive capital. But success hinges on understanding the patterns and signals that drive these movements.
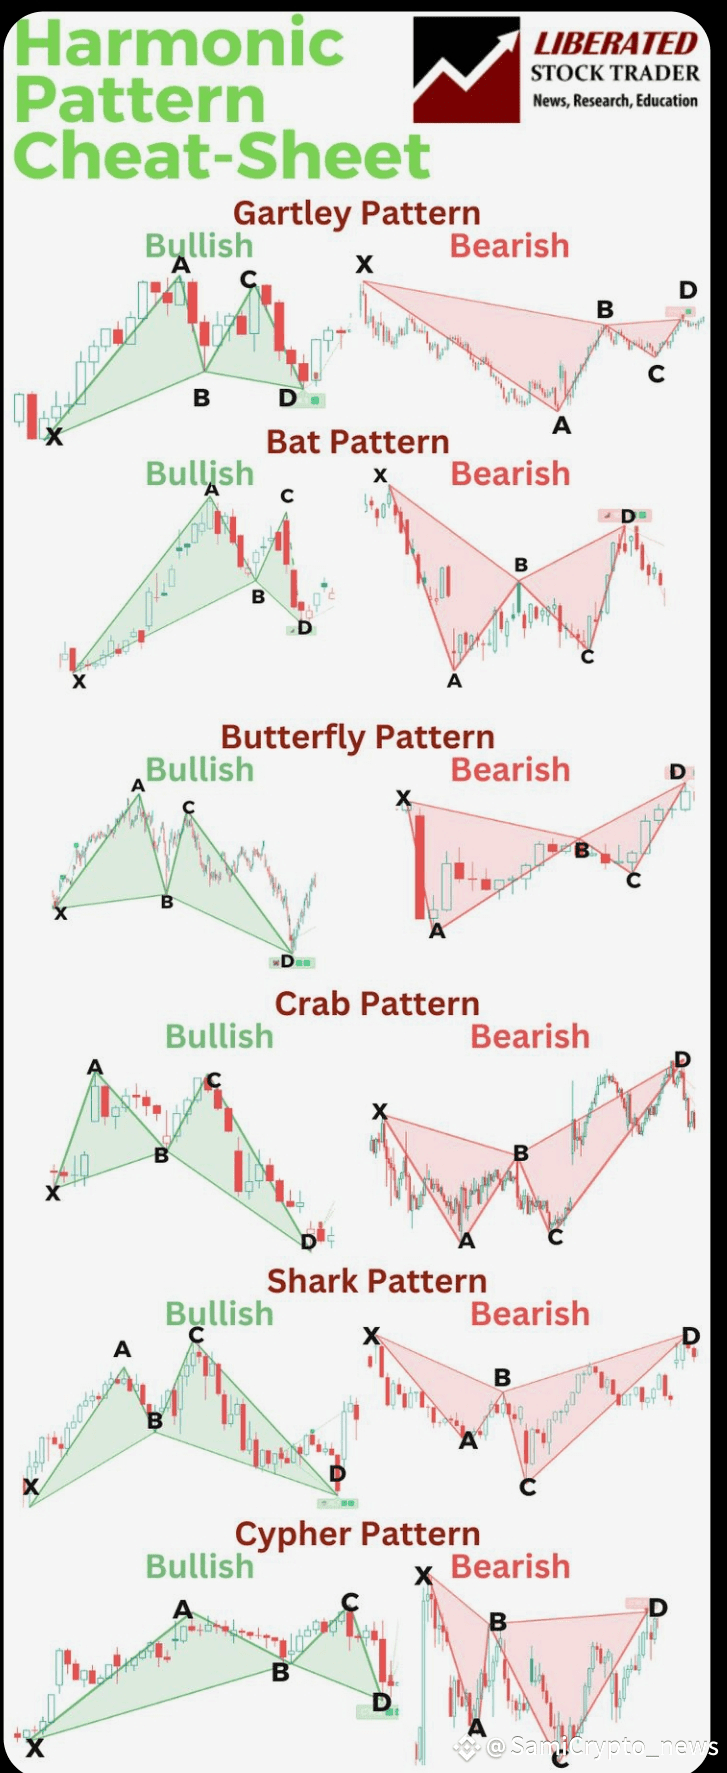
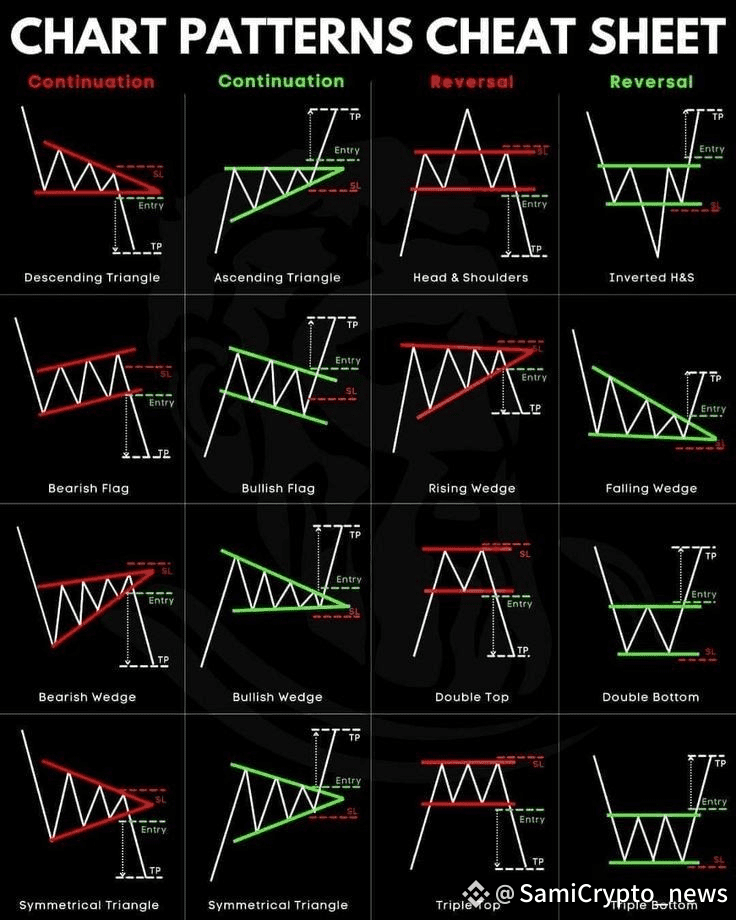
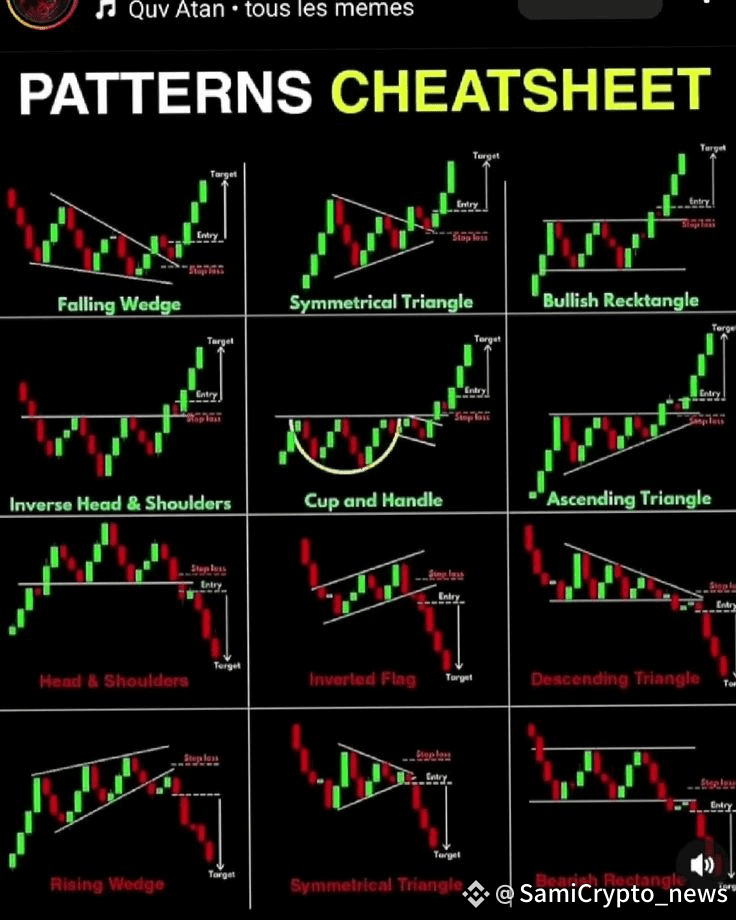
💡Mastering Chart Patterns and Candlesticks: Your Guide to Growing a Small Crypto Account 📉📈💸
Disclaimer: Includes third-party opinions. No financial advice. May include sponsored content. See T&Cs.

BTC
117,426.98
-0.28%
