Ethereum (ETH)-based altcoins are gradually regaining their momentum as market sentiment improves, amid Bitcoin (BTC) and the total cryptocurrency market capitalization continuously setting new highs. Technical analysis for Bonk (BONK), Floki (FLOKI), and Ondo Finance (ONDO) reveals strong bullish potential, as signs of trend reversal become increasingly clear.
ONDO targets higher levels thanks to the golden cross
Ondo Finance – a project that tokenizes real-world assets (RWA) on the Ethereum platform – recorded a 3% increase on Thursday, approaching the 38.2% Fibonacci retracement level at $1.19, calculated from the peak of $2.04 (12/15) to the trough of $0.67 (6/22).
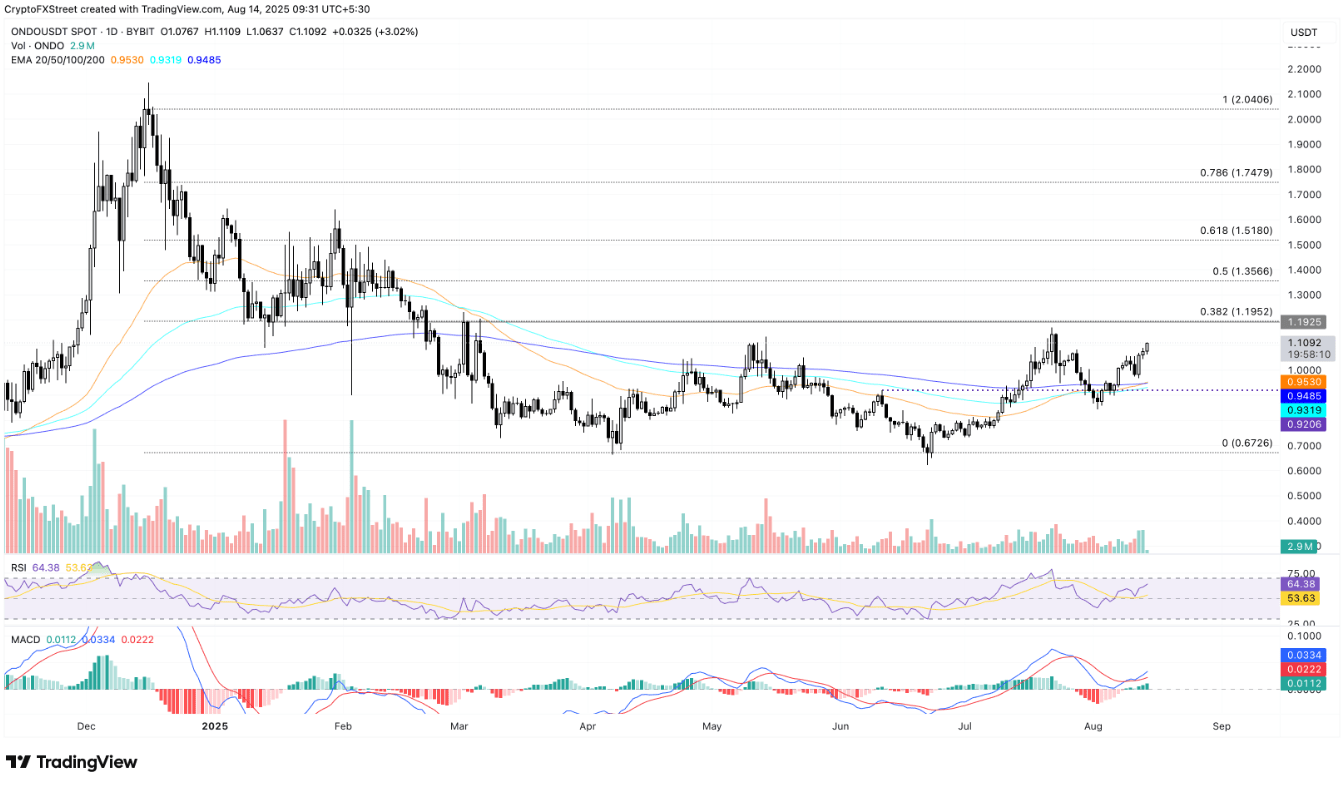
This breakout has triggered a golden cross pattern as the 50-day EMA crosses above the 200-day EMA, signaling the potential for a trend reversal to bullish. Other technical signals also support the bulls: the RSI reached 64, approaching the overbought zone, while the MACD maintains an upward trend with the signal line continuing to rise and the green histogram expanding.
If the price decisively breaks above $1.19, ONDO could extend its upward trend towards $1.35 – corresponding to the 50% Fibonacci retracement level.
BONK aims to break out of the accumulation zone
The meme coin Bonk has continued its upward streak into the third consecutive day, with a slight increase of 2% in Thursday's trading session. Currently, BONK is accumulating within the range from the 50% to 61.8% Fibonacci retracement levels, corresponding to $0.00002350 – $0.00002958. This price range is defined from the peak of $0.00006230 set on 11/20 to the trough of $0.00000886 recorded on 4/7.
A notable turning point comes from Safety Shot – a company listed on NASDAQ – when it announced plans to establish a $25 million digital asset fund for BONK. This move could act as a catalyst to boost 'risk-on' sentiment towards BONK, especially within the community of retail investors.
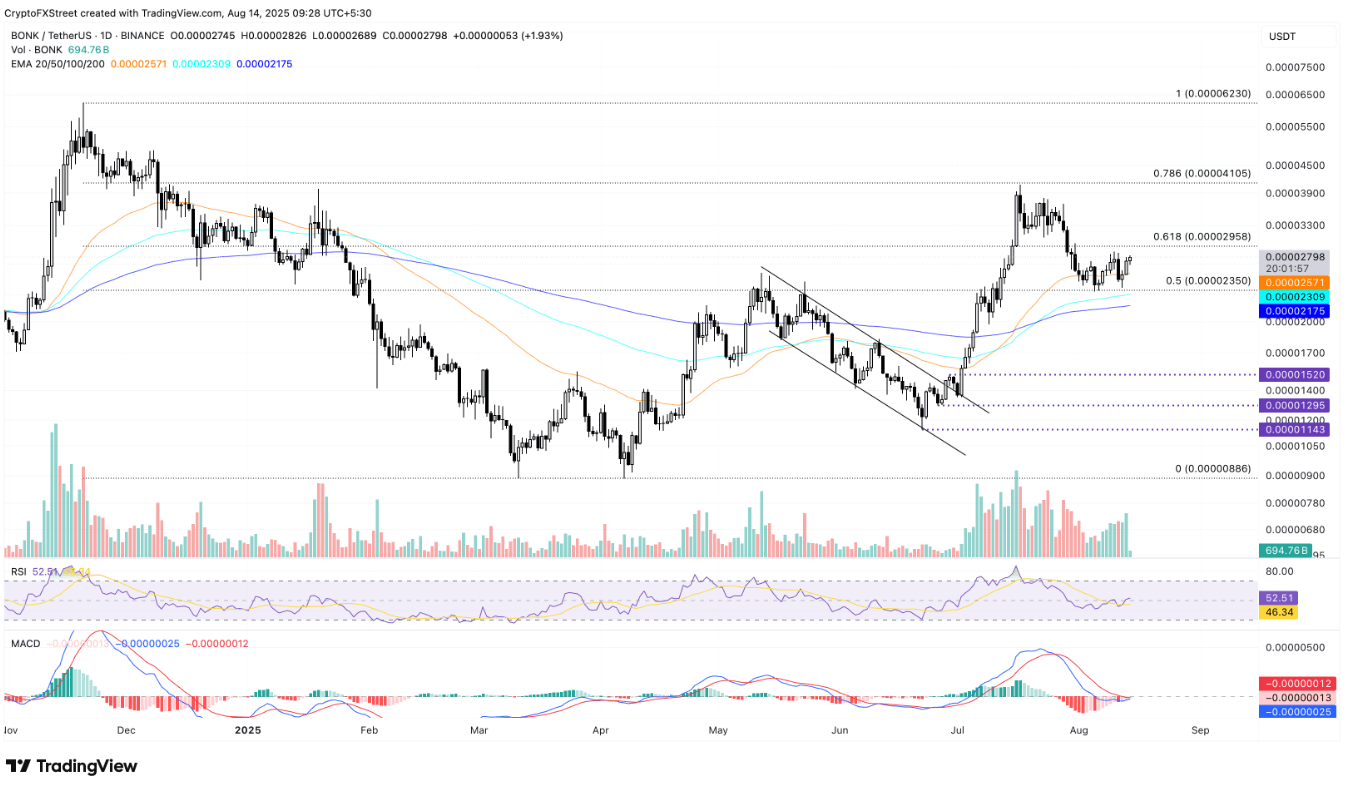
The exponential moving averages (EMA) of 50, 100, and 200 days are all trending upwards, reflecting a bullish trend and may serve as a dynamic support cushion when the market faces selling pressure. If BONK decisively closes above the threshold of $0.00002958, the upward momentum could extend to the 78.6% Fibonacci retracement level at $0.00004105 – equivalent to a potential increase of 46% compared to the current price.
Investors on the sidelines may wait for the MACD to cross above the signal line as a confirmation of trend reversal, opening up opportunities to enter the market. Meanwhile, the relative strength index (RSI) on the daily chart is currently at 52 – near the neutral level – indicating that trading remains quite balanced. If the RSI makes a strong breakout, this could further bolster BONK's momentum.
Conversely, the bullish scenario will be invalidated if BONK loses the important support level at the 50% Fibonacci retracement level of $0.00002350.
FLOKI reinforces the recovery momentum
Floki – one of the meme coins with the most impressive performance during the 'frenzy' of 2021 – is signaling a strong comeback. As of Thursday afternoon, FLOKI's price has risen over 2%, marking a streak of three consecutive green candle sessions after bouncing off the 50-day EMA.
The bulls still maintain an advantage by holding above the 23.6% Fibonacci retracement level at $0.0001031, measured from the peak of $0.0002900 (11/21) to the trough of $0.0000454 (4/7). This movement reflects the potential for a short-term reversal, while also opening up the opportunity to form a 'golden cross' between the 100-day and 200-day EMAs – a technical signal that often precedes a sustainable upward trend.
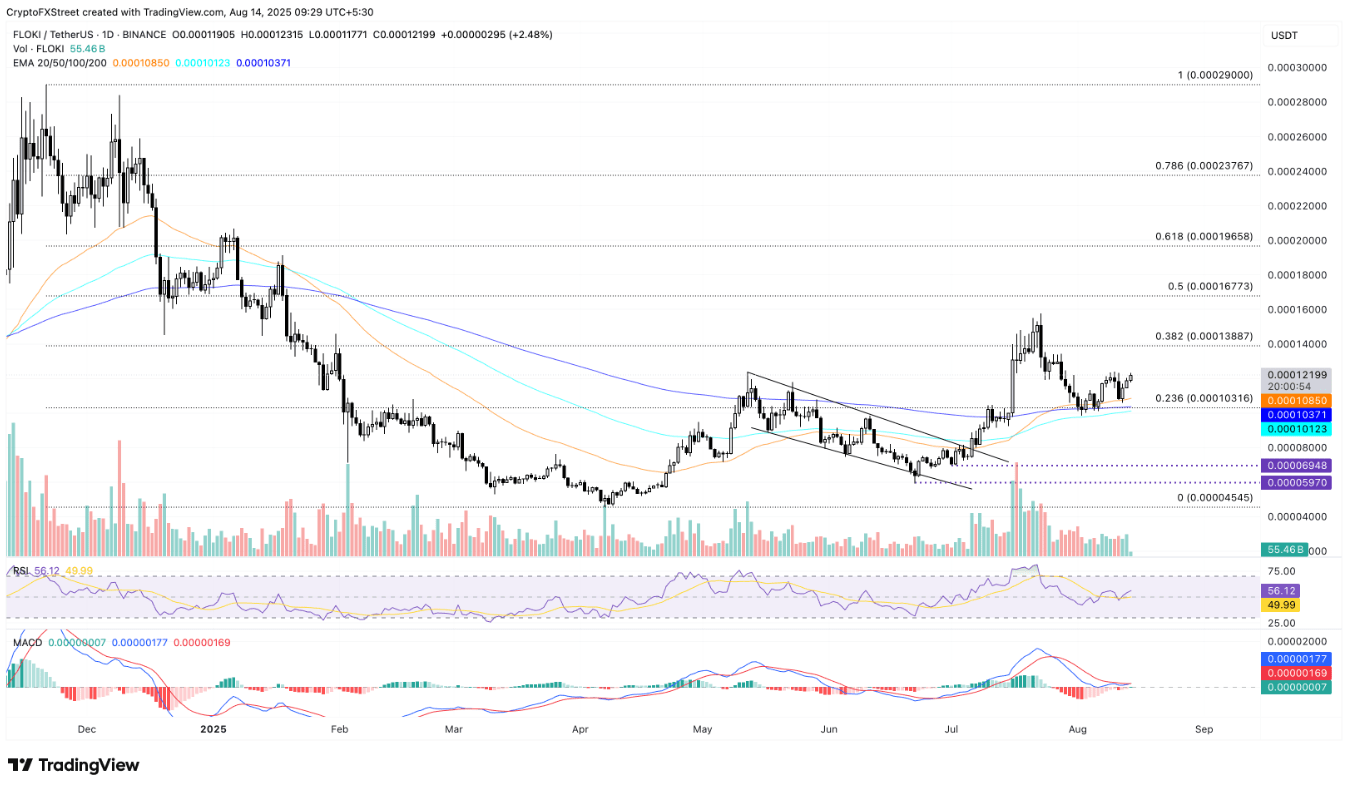
The nearest target for FLOKI is the 38.2% Fibonacci level at $0.0001388. If the price closes above this level, the coin could proceed to test the 50% Fibonacci retracement level at $0.0001677.
Momentum indicators are also reinforcing the bullish scenario. On the daily chart, the RSI reached 56 and is trending upwards, indicating there is still room for upward movement as buying pressure increases. The MACD line is also nearing the signal line to create a crossover – a signal that often adds strength to the upward trend.
Conversely, if the price breaks below the 200-day EMA near the psychological level of $0.0001000, the bullish scenario will be negated.