Why did the US PPI data exceeding expectations trigger a major drop in the crypto market?
Today, the movement of ETH/USDT is clearly influenced by US economic data, especially the PPI data significantly exceeding expectations, leading to weakened market expectations for Fed rate cuts, which in turn triggered a drop in ETH prices. We analyze the reasons for the bearish phenomenon from both fundamental and technical perspectives.
Fundamentals: US PPI data exceeds expectations, market panic sentiment intensifies.

PPI data far exceeds expectations, inflation pressure rebounds.
US July PPI year-on-year: announced value 3.3%, far higher than the expected 2.5%.
US July PPI month-on-month: announced value 0.9%, far exceeding the expected 0.2%.
PPI is an indicator of changes in production costs for enterprises, often seen as a leading indicator of CPI. A significant rise in PPI indicates an increase in production costs, which may later be passed on to consumer prices, leading to a rebound in inflation.
The expectation of a Fed interest rate cut is postponed, market liquidity tightens.
The market originally expected the Fed to cut interest rates in September or by the end of the year, but after the PPI data exceeded expectations, the expectation of a rate cut has significantly cooled.
High interest rates = high capital costs = reduced market liquidity, which is bearish for high-risk assets.
Although the jobless claims data met expectations, the impact is limited.
The number of initial jobless claims in the US is 224,000, slightly lower than the expected 228,000, indicating that the job market remains strong.
However, compared to the impact of PPI, the jobless claims data has a smaller effect, and the market is more concerned about inflation issues.
Summary: PPI data exceeds expectations → Inflation concerns intensify → Fed interest rate cut postponed → Market liquidity tightens → Funds withdraw from high-risk assets.
Technical outlook: ETH has broken through key support levels, and the short-term trend is bearish.
From the 1-hour K-line chart of ETH/USDT:
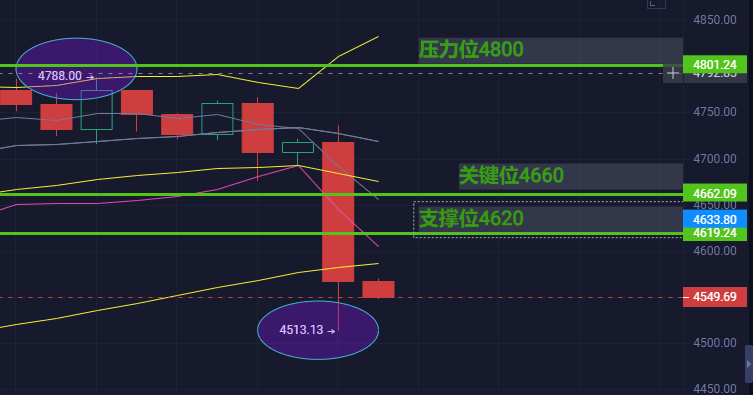
Key support level 4660 has been broken, short-term trend weakens.
Support level 4660 USDT has been broken, indicating significant market selling pressure.
Currently, the price is fluctuating around 4620 USDT, and it may continue to explore downward in the short term.
Upper pressure level 4800 USDT, if it cannot break through, the rebound space is limited.
Technical indicators show that the downward momentum is increasing.
MACD: The fast line crosses below the slow line, and the histogram extends downward, indicating that the downward momentum is still increasing.
Bollinger Bands: The price has broken below the middle line, and the Bollinger Bands are widening, indicating increased volatility, and short-term may continue to decline.
Market sentiment is bearish, buying the dip needs to be cautious.
ETH current decline -2.74%, trading volume has increased, indicating that market panic sentiment is intensifying.
In the absence of obvious positive stimuli, the short-term may continue to fluctuate downwards, suggesting to observe and not rush to buy the dip.
Market outlook: ETH may continue to be under pressure in the short term, pay attention to the 4500 support.
Short-term trend.
If 4620 USDT cannot stabilize, it may further explore the support around 4500 USDT.
If there is a rebound, pay attention to whether 4660 USDT can stabilize again.
Qing Yao's operation suggestion.
Short-term traders: temporarily observe and wait for clearer signs of a stop-loss.
Medium to long-term investors: if ETH drops to around 4500, consider building positions in batches, but control the position size to prevent further downside risk.