Reading a crypto chart is one of the most important skills for any trader — whether you’re a beginner or experienced. Charts help you visualize price movements, market psychology, and potential trading opportunities.
---
1️⃣ Candlesticks
Each candlestick represents price action for a specific time frame.
Open: The price at the start of that period.
Close: The price at the end of that period.
High: The highest price reached.
Low: The lowest price reached.
Green candle: Price went up during the period.
Red candle: Price went down during the period.
---
2️⃣ Support & Resistance
Support: A price level where buying pressure is strong enough to prevent the price from falling further.
Resistance: A price level where selling pressure is strong enough to stop the price from rising further.
These levels help traders decide entry (buy) and exit (sell) points.
---
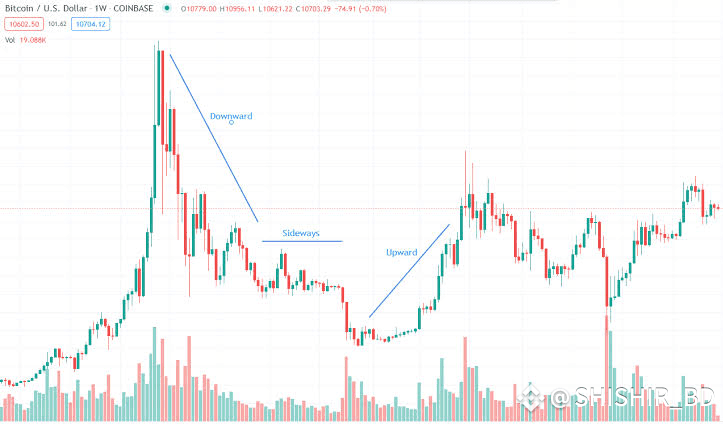
3️⃣ Trend Lines
Uptrend: Series of higher highs & higher lows → Market is bullish.
Downtrend: Series of lower highs & lower lows → Market is bearish.
Sideways: Price moves in a range without clear direction.
---
4️⃣ Volume
Shows how much of the asset is being traded.
High volume: Confirms strength of a price move.
Low volume: Indicates weak or uncertain market moves.
---
5️⃣ Indicators
RSI (Relative Strength Index): Measures overbought/oversold conditions.
MACD (Moving Average Convergence Divergence): Shows momentum shifts.
Moving Averages: Smooth out price data to identify trends.
---
💡 Pro Tip: Never rely on one indicator alone. Always combine technical analysis with market news and overall sentiment.
#CryptoTrading #ChartAnalysis #TechnicalAnalysis #Binance #BTC #ETH #SOL #CryptoEducation #LearnTrading