
Original author: Michael Nadeau, founder of The DeFi Report
Original translation: Azuma, Odaily
Reprint: Oliver, Mars Finance
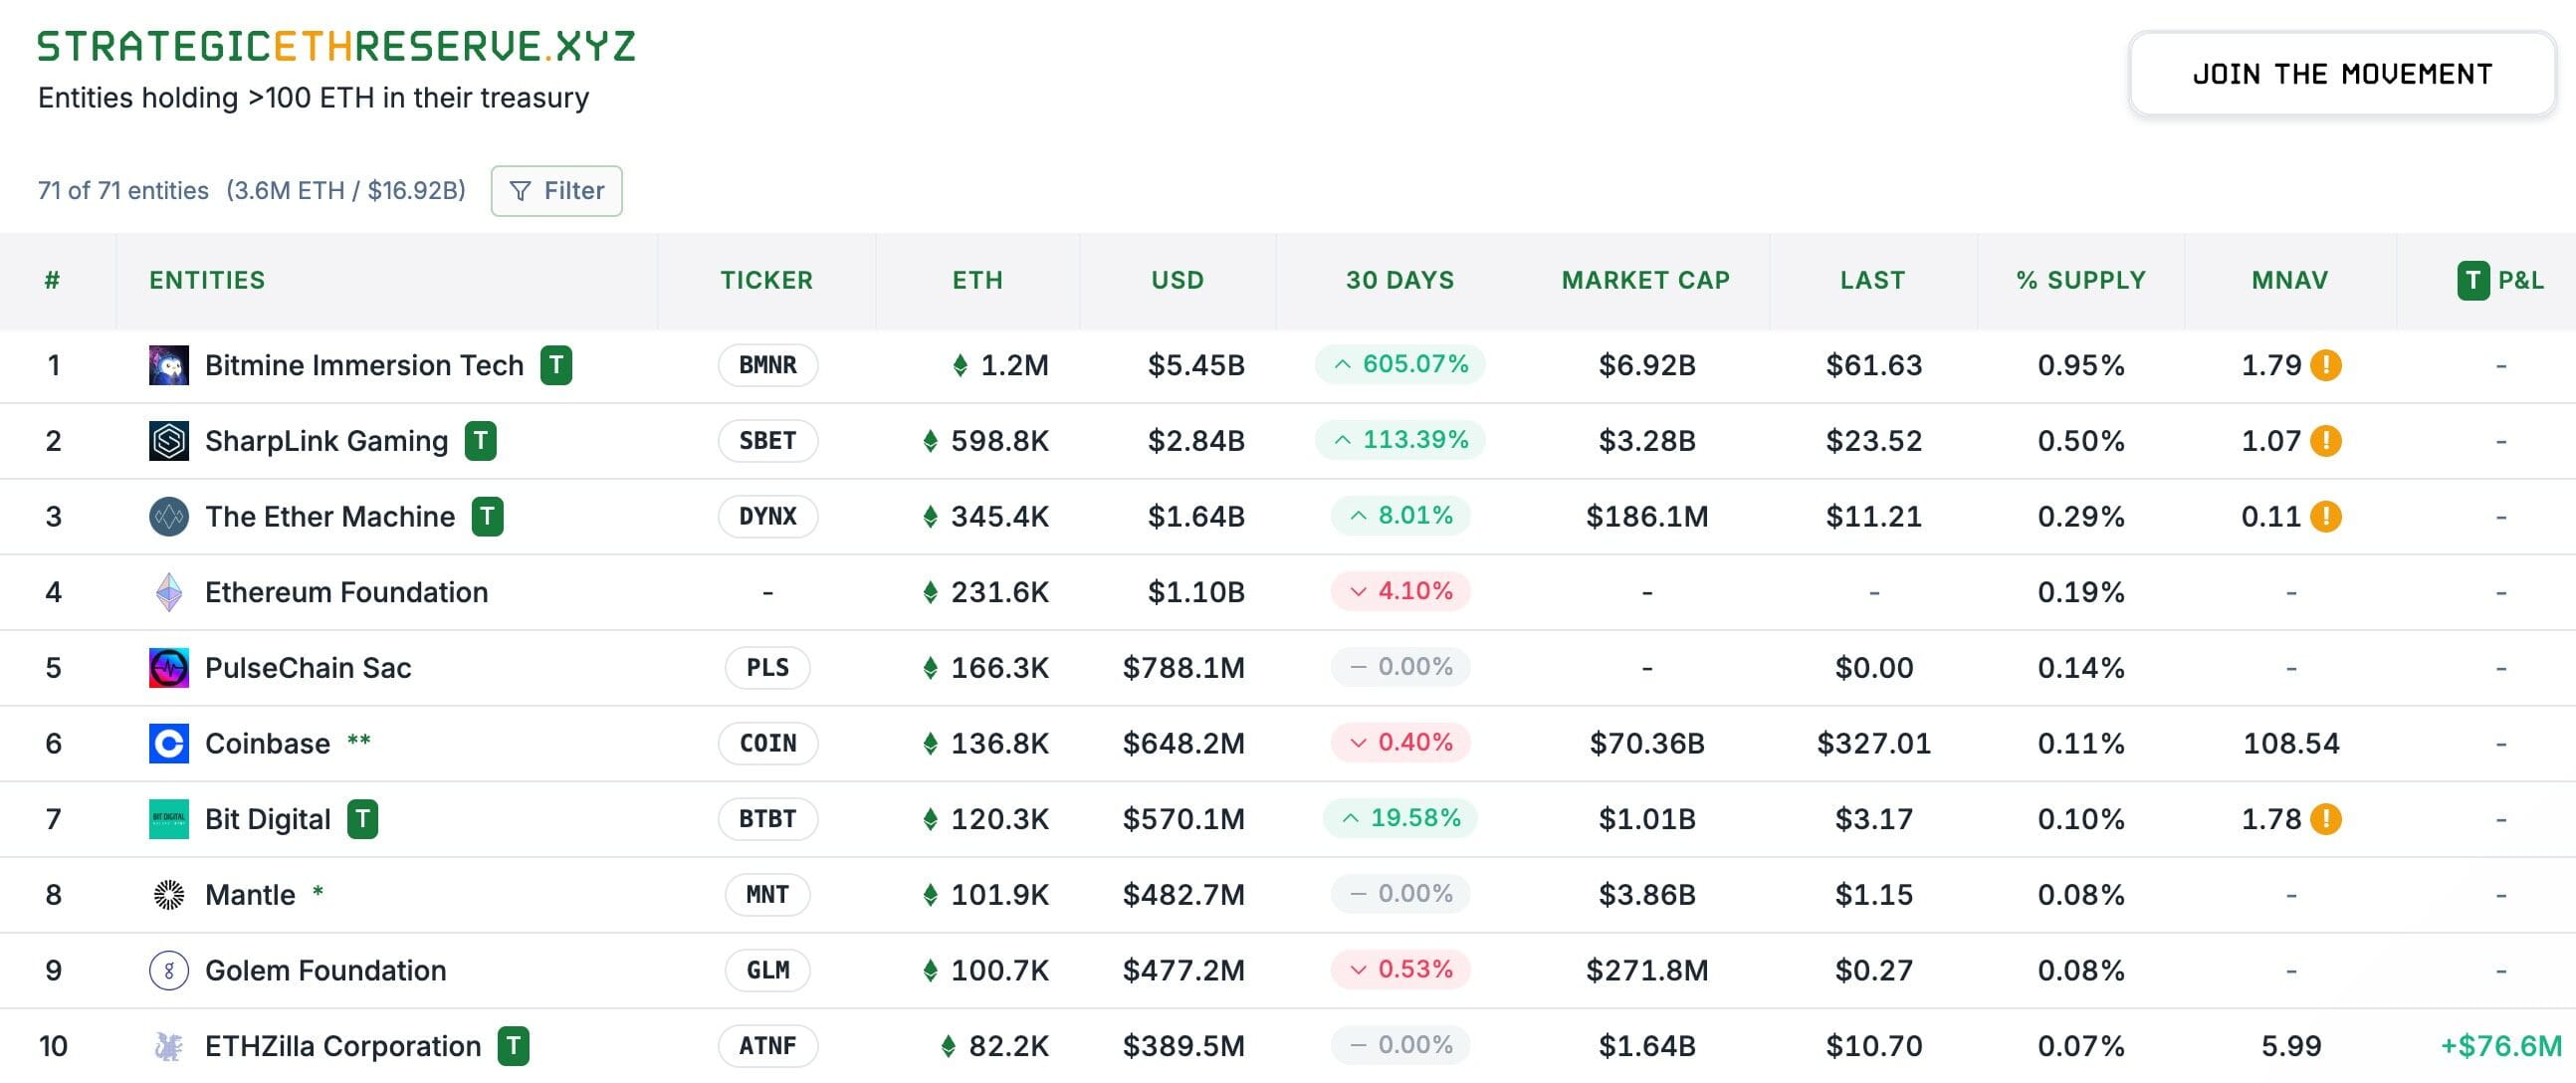
Editor's note: The crazy buying spree of ETH treasury companies has become the hottest topic in the recent market, constituting the strongest 'buying surge' for ETH prices. Strategic ETH Reserve data shows that as of August 14, Beijing time, the total holdings of major ETF treasury companies have reached 3.57 million ETH, worth about $16.92 billion, with BitMine (BMNR), Sharplink Gaming (SBET), and The Ether Machine (DYNX) ranking in the top three with holdings of 1.2 million, 598,000, and 345,000 ETH respectively.
This morning, Michael Nadeau, founder of The DeFi Report, who has long been concerned about the status of ETH, reviewed the distribution of ETF holdings outside of treasury companies and the changing trends (Note: There may be some overlap between the holdings of treasury companies and the classifications below), which may help you assess the future动力来源 of ETH.
The following is the original text by Michael Nadeau, compiled by Odaily Planet Daily.
People always discuss the price trend of ETH, but the real key lies in its distribution pattern. Once you see the actual distribution of ETH—existing in different domains like ETFs, staking contracts, Layer 2, wrapped tokens, exchanges, etc.—you will gain insight:
Who truly holds the control;
Capital flow and actual liquidity size;
Where might the next 'buying surge' come from;
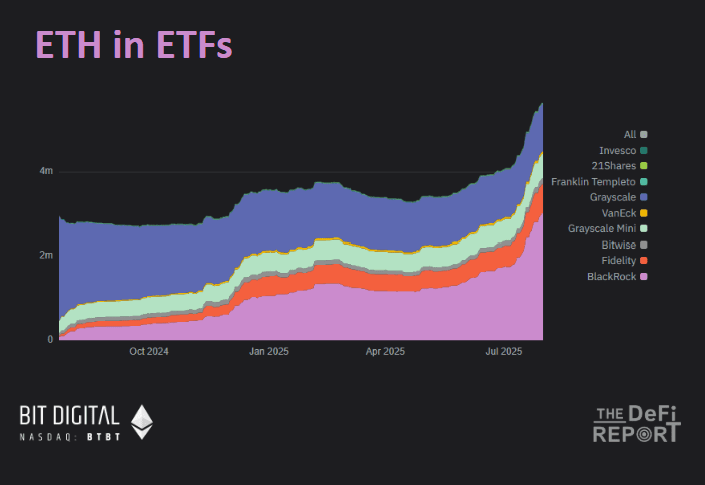
ETF Holdings
Various Ethereum ETFs currently control about 5% of the ETH supply.
In the past 3 months, the assets under management of ETH ETFs have grown by 80%, with BlackRock and Fidelity's ETFs accounting for 73% of the AUM.
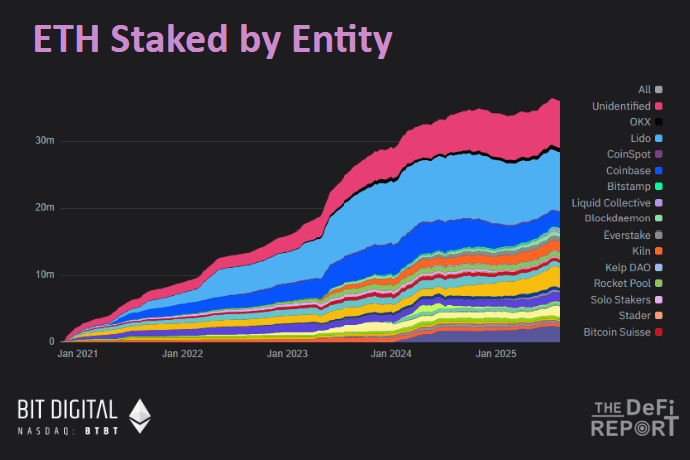
Staking
Currently, about 29.7% of ETH is staked.
In the past three months, the staking size of ETH has grown by 5%, while the market share of staking leader Lido has decreased by 3.5%, and Binance's staking share has increased by 23%, currently ranking second in market share.
As more ETH treasury companies stake their ETH, we expect this number to continue to rise in the coming months.
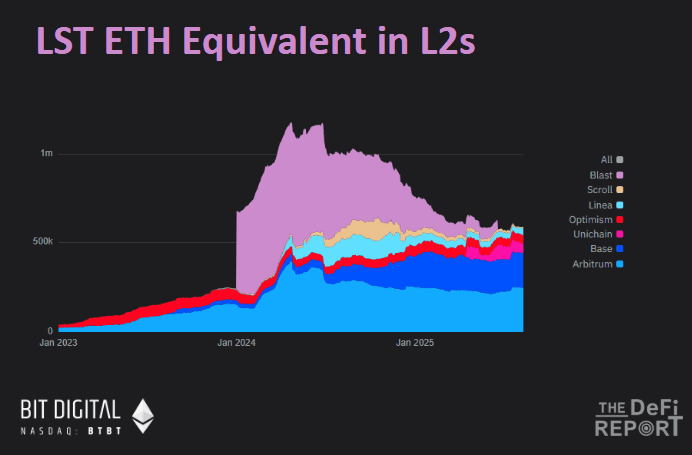
Layer 2 (including LST)
ETH in Layer 2 currently accounts for only 5% of the circulating supply.
Over a year ago, Blast accounted for 52% of the Layer 2 ETH supply, and now it's almost 0%—the incentive program was simply a waste of money. Currently, 41% of ETH in Layer 2 is on Arbitrum, and 33% is on Base.
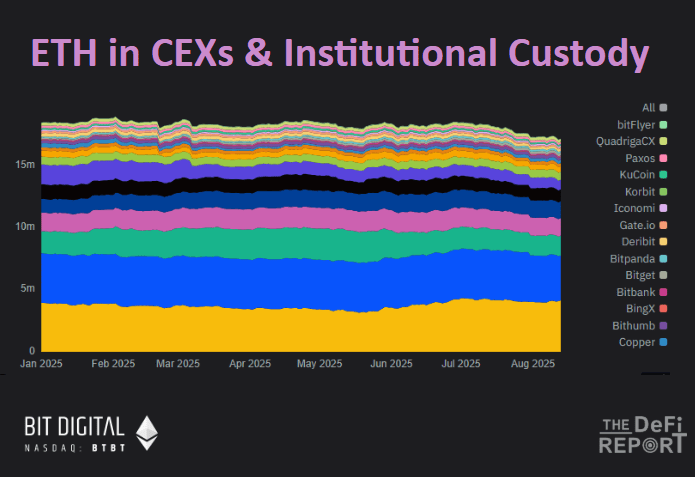
Centralized Exchanges (CEX)
Currently, the total ETH in major CEXs accounts for 14% of the circulating supply.
Since the third quarter, this figure has dropped by 6.7%, currently at its lowest level since July 2016.
Where has all this ETH gone? Most of it has gone into staking contracts and cold wallets.
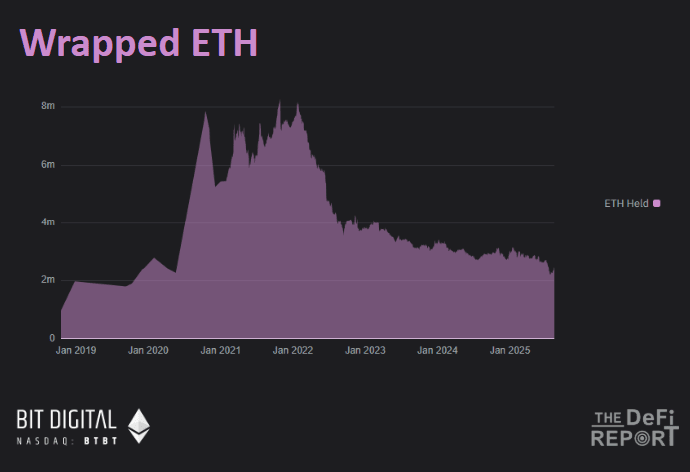
Wrapped ETH
Wrapped ETH currently accounts for only 1.8% of the circulating supply.
Since the beginning of 2022, this figure has decreased from its peak by 70%, and this downward trend aligns with the upward trend of ETH in staking contracts.
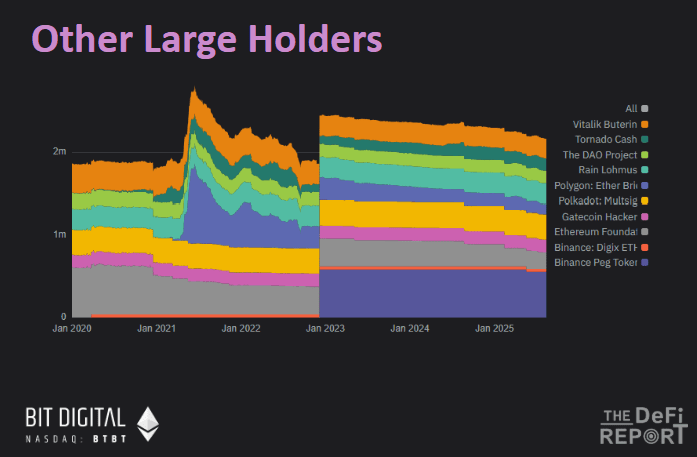
Other large holding entities and individuals
Apart from the above categories, other large holding entities and individuals account for about 1.7% of ETH holdings.
Of the 1.7%, Binance's Binance Peg Tokens Fund accounts for about 25%, while Polygon Bridge, Tornado Cash, the Ethereum Foundation, and Vitalik himself are the main holders.
In summary, the above six charts cover about 55% of the ETH supply. Besides that, the remaining ETH is mostly held in external accounts (EOA) and cold wallets.


