ARB surged to a local high of $0.5874 before entering a corrective phase, now consolidating near the $0.5425 level. The Fibonacci retracement overlay reveals price is hovering around the 0.618 level ($0.5493), a critical area where bulls often return.
Support Zones:
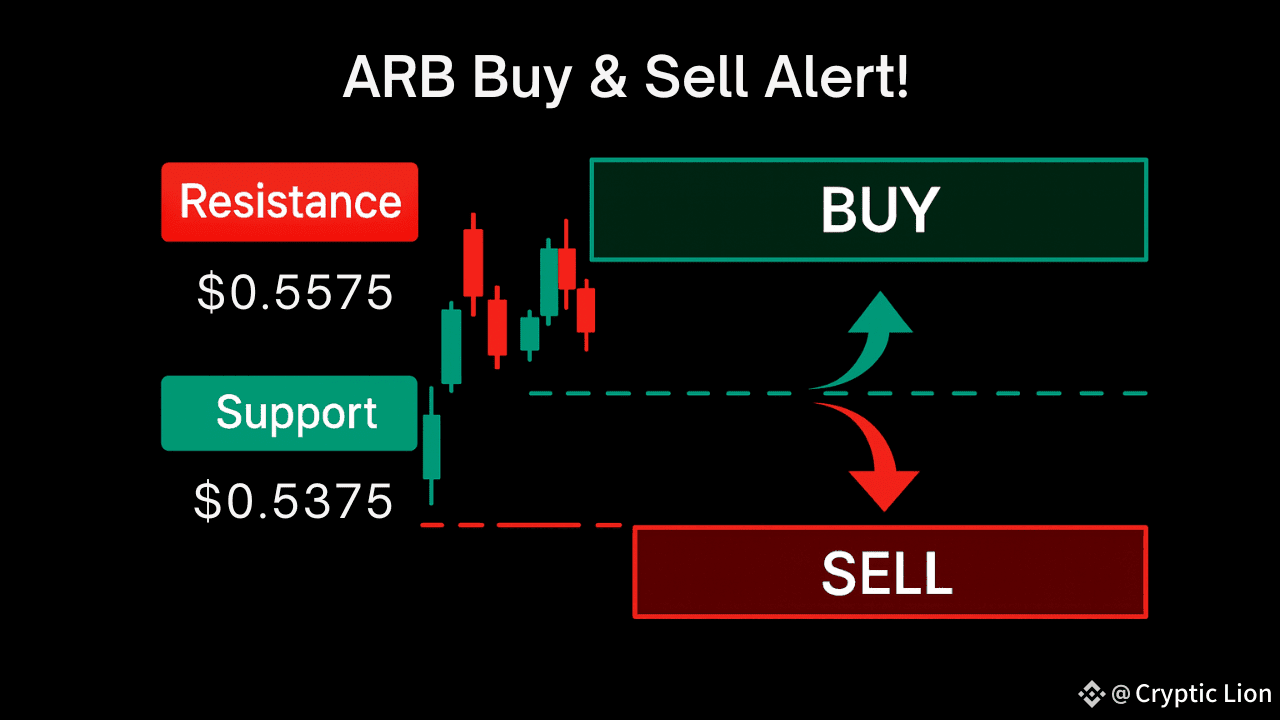
$0.5375 (Fib 0.5) – Mid-level support
$0.5257 (Fib 0.382) – Deeper bullish buy zone
$0.5112 (Fib 0.236) – Breakdown risk zone
Resistance Levels:
$0.5575 – Short-term resistance and EMA confluence
$0.5660 – Fibonacci 0.786 retracement
$0.5874 – Local high and breakout confirmation level
The Volume Oscillator remains weak at -16%, suggesting declining buying pressure. However, the price structure is holding higher lows so far. If bulls defend $0.5375–$0.5257, we could see a rebound toward $0.5660, with a breakout eyeing $0.5874 again.
💼 Trade Setup:
Entry Zone: $0.5375–$0.5257
Take Profit: $0.5575 / $0.5660 / $0.5870+
Stop-Loss: Below $0.5110
📉 Watch for volume pickup before entering. Losing $0.5257 could trigger a slide toward $0.50.
Click the cash tag $ARB to follow or trade the move. This setup may reward the patient trader—if bulls step back in.