Basic evaluation techniques for MACD and KDJ indicators will help you navigate the cryptocurrency market with ease and confidence.
The most important aspect of investing is not how much you can earn in one go, but whether you can control risks and achieve steady long-term profits. Before any operation, you must first observe the trend, find the right entry point after confirming the trend, and finally manage the timing. By finding the correct direction, you can minimize risks and maximize profits. Because of our focus, under Mr. Coin's professional guidance, everyone has their own unique experiences and stories!
Technical Post - Basic Evaluation Techniques and Introduction to MACD
MACD can generally be used as a medium-term indicator to determine short-term reversal points. Its principle is to use the signs of aggregation and dispersion of short-term (fast) and long-term (slow) moving averages to perform double smoothing calculations to determine the timing for buying and selling. This indicator is particularly suitable for analyzing and judging trends in mainstream coins and inactive coins that are at low levels for a long time, while it is not as responsive as KDJ for small coins and mainstream coins.
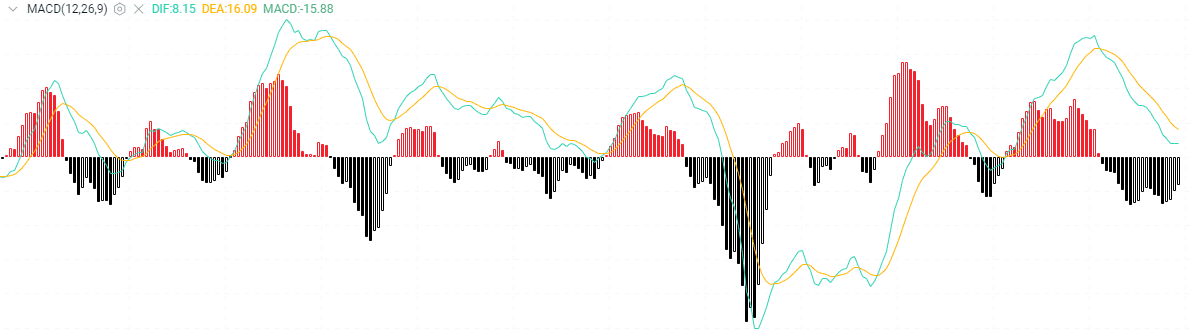
Basic evaluation techniques for MACD include
Principle 1: If DIF > 0 and DEA > 0, the current trend belongs to a bullish background; if DIF < 0 and DEA < 0, the current trend belongs to a bearish background. In practical trading thinking, the main position should align with the market background.
Principle 2: When the DIF and DEA form a golden cross, that is when the BAR changes from negative to positive, it is a buy signal; when the DIF and DEA change from negative to positive, it is also a buy signal. If the trend of the asset at this time is upward, the reliability is stronger.
Principle 3: When the DIF and DEA form a counter-cross, that is when the BAR changes from positive to negative, it is a sell signal; when the DIF and DEA change from positive to negative, it is also a sell signal. If the trend of the asset at this time is downward, the reliability is stronger.
Principle 4: When the cryptocurrency price has risen for a period and hits a new high again, while the DIF and DEA do not reach new highs, one should be cautious of a potential price peak.
Principle 5: After the cryptocurrency price has declined for a period and hits a new low again, while the DIF and DEA do not reach new lows, one should be cautious of a potential price bottom.
Principle 6: At high price levels, two counter-crosses should be cautious of a significant drop; at low price levels, two golden crosses should be careful of a stop in decline; at this time, trading volume or opposing news has a considerable impact on the cryptocurrency price.
Principle 7: When BAR > 0, if the BAR line flattens, it is a short-term sell signal; when BAR < 0, if the BAR line flattens, it is a short-term buy signal.
Principle 8: When the market is in a sideways consolidation, the cryptocurrency price fluctuates little, and the accuracy of the MACD indicator is relatively high; at the same time, using MACD to guide operations should also consider the combination with trading volume and KDJ.
Technical Analysis - KDJ Indicator
The KDJ indicator, also known as the stochastic indicator, was first proposed by Dr. George Lane and is a rather novel and practical technical analysis tool. It was originally used for analysis in the futures market and later widely used for medium to short-term trend analysis in markets such as crude oil. It is one of the most commonly used technical analysis tools in financial markets like futures and crude oil.
1. Basic Definition of KDJ Indicator
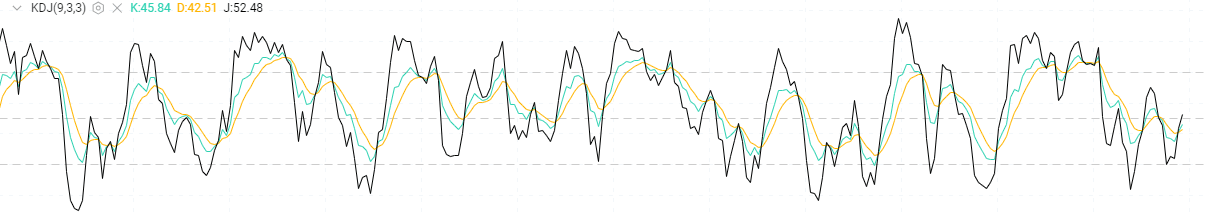
The KDJ indicator, calculated using the highest price, lowest price, and closing price as basic data, forms points on the indicator's coordinates represented by the K, D, and J values. Connecting countless such points forms a complete KDJ indicator that reflects price fluctuation trends. It mainly uses the real amplitude of price fluctuations to indicate the strength of price trends and overbought/oversold conditions, serving as a technical tool that issues buy/sell signals before price rises or falls.
2. The main points for practical evaluation of the KDJ indicator are as follows:
(1) Overbought and Oversold
(1) The K line is a quick confirmation line - values above 90 indicate overbought, values below 10 indicate oversold.
(2) The D line is a slow main line - values above 80 indicate overbought, values below 20 indicate oversold.
(3) The J line is a direction-sensitive line. When the J value exceeds 100, especially for more than five consecutive periods, the cryptocurrency price will at least form a short-term top. Conversely, when the J value is below 0, especially for several consecutive periods, the cryptocurrency price will at least form a short-term bottom.
(2) Golden Cross
When the K value gradually increases beyond the D value, and the K line crosses above the D line on the chart, it indicates an upward trend. Therefore, when the K line breaks above the D line, it is a buy signal. In practice, when the K and D lines cross upward below 20, this short-term buy signal is quite accurate. If the K value is below 50 and crosses above the D value twice from below, forming a right bottom that is higher than the left bottom in a 'W bottom' shape, the cryptocurrency price may see a considerable increase.
(3) Death Cross
When the K value gradually decreases below the D value, and the K line crosses below the D line on the chart, it indicates a downward trend. Therefore, when the K line breaks below the D line, it is a sell signal. In practice, when the K and D lines cross downward above 80, this short-term sell signal is quite accurate. If the K value is above 50 and crosses below the D value twice from above, forming a right head that is lower than the left head in an 'M head' shape, the cryptocurrency price may see a considerable drop.
(4) Divergence
By analyzing the divergence of KDJ and cryptocurrency prices, judging the peaks and troughs is also a quite practical method.
(1) The cryptocurrency price hits a new high, but the KD value does not hit a new high, indicating a bearish divergence; it is time to sell.
(2) The cryptocurrency price hits a new low, but the KD value does not reach a new low, indicating a bullish divergence; it is time to buy.
(3) The cryptocurrency price does not hit a new high, but the KD value does hit a new high, indicating a bearish divergence; it is time to sell.
(4) The cryptocurrency price does not hit a new low, but the KD value does hit a new low, indicating a bullish divergence; it is time to buy.
It is important to note that the method for determining KDJ top and bottom divergence can only be compared to the previous high and low points of the KD value, and cannot skip comparisons. Of course, every advantage has its disadvantage; due to KDJ's high sensitivity, it may frequently change and sometimes produce false signals. Correctly using the KDJ indicator can help you navigate the cryptocurrency market with ease and confidence.
I am Awen! I release market analysis and guidance strategies regularly every day, along with occasional live calls! My team will be carefully crafted by Mr. Coin and over 20 top analysts in the industry, specializing in various technical indicators, K-line pattern analysis, and in-depth interpretation of fundamentals, aiming to provide cryptocurrency friends with free technical support and risk management.
, thus making more rational trading decisions.
The road of trading is full of uncertainties, and every decision must be made with caution. By constantly learning, improving your knowledge and skills, and maintaining a good mindset, you can go further on this road and gain more. It is not just a pursuit of wealth but also a process of self-awareness and growth.
For more real-time trades, you can follow the names for online technical learning, breaking out of positions, etc. I have researched the market for many years, studying major trends in the cryptocurrency circle, and have studied abroad multiple times, mainly analyzing and guiding BTC, ETH, DOT, LTC, FIL, EOS, BCH, ETC, etc. For those who are unsure about trading, I welcome everyone to study and learn together.


