Today, let's talk plain language about BTC's 1-hour trend, first translating complex technical indicators into simple terms.
Current Situation: Short-term 'braking', but not completely 'stalled'
Look at this 1-hour chart

A few days ago, the price surged to around 124545, which was like the previous ceiling, but it couldn't stabilize and is now starting to pull back. Fortunately, when it dipped to the critical support level of 120095, which is roughly the starting line for this recent uptrend, it momentarily stopped, like a car approaching an intersection with a yellow light, hitting the brakes, but the vehicle hasn't completely tilted.
Key Signal: Support level becomes a 'death line', volume shows no panic
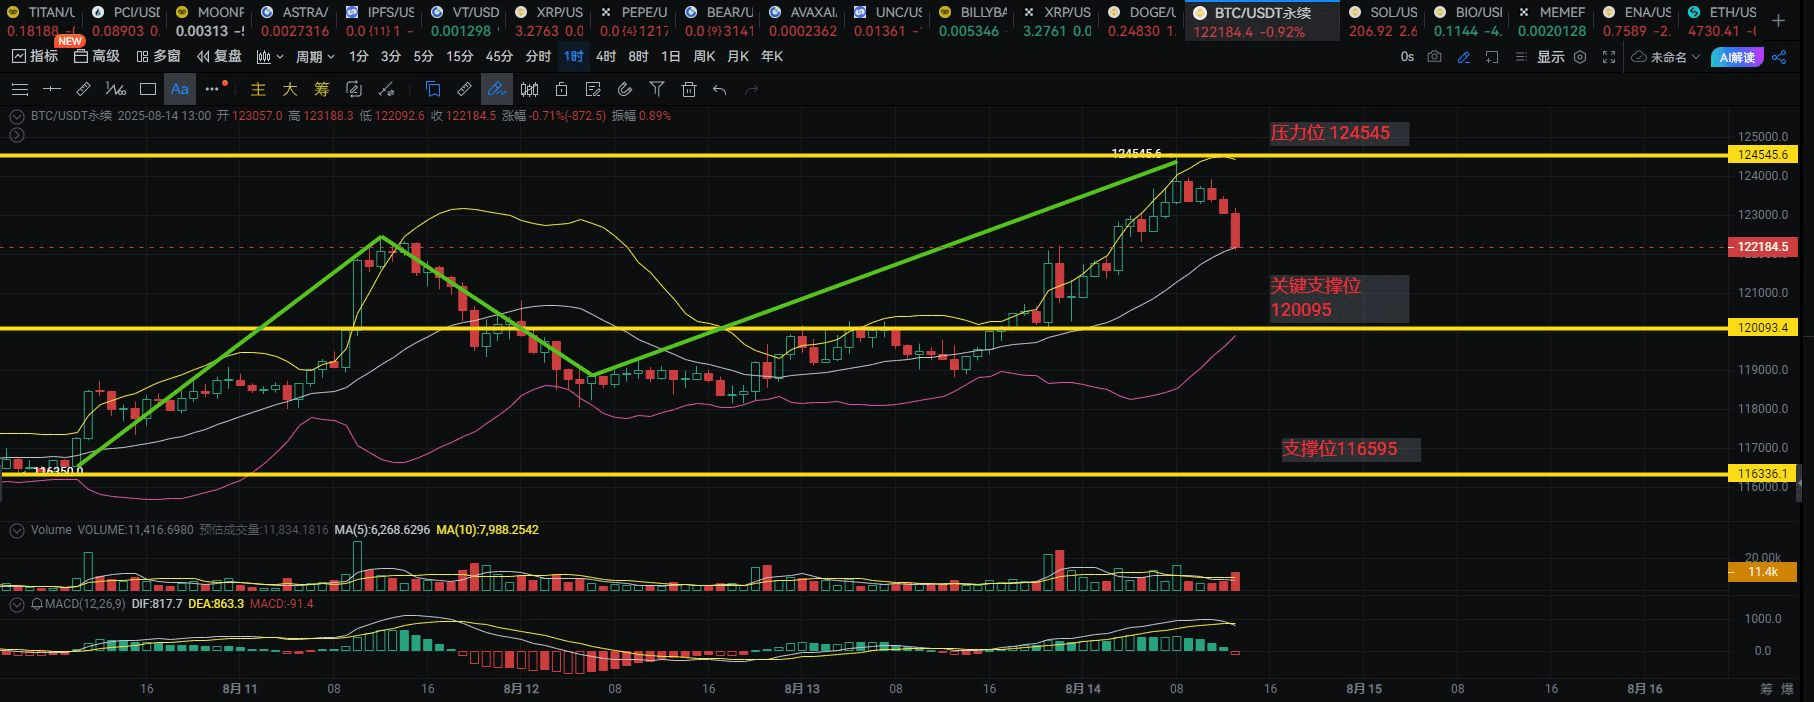
Support Level Performance: The line at 120095 is particularly important. If it breaks, there is still 116595 as a 'backup buffer zone' below, but for now, let's see if we can hold this 'first line of defense'. Currently, the price is hovering here, indicating a 'tug of war' between bulls and bears, with bulls temporarily preventing the price from collapsing.
Volume: No panic selling during the drop, just a normal pullback: During the decline, the trading volume didn't suddenly spike, indicating there was no 'panic sell-off'. This suggests that only those who made money earlier are taking profits, not a 'mass exodus', but a 'normal deep breath' during the uptrend.
MACD Details: Although the short-term indicators show slight divergence with the new high in price, the indicators haven't followed suit, but overall, it remains above the zero line, indicating that the big trend is still bullish, just that the short-term needs a breather.
Next, there are two possible 'scripts', and you need to focus on these two points:
1. Support level holds, continue to push higher
If 120095 holds steady and the trading volume gradually warms up, the price is likely to rebound and challenge the resistance level of 124545 again. If it can break through with increased volume, the next wave might aim for the previous high or even higher.
2. Support level can't hold, short-term pullback to fill the gap
If 120095 is breached, don't panic! First, check if 116595 below can hold, which is equivalent to this wave of market's 'airbag'. If it holds here, then it’s a 'golden pit', and the pullback is a buying opportunity; but if it breaks down directly, be cautious of further adjustments in the short term, possibly retracing to lower positions to find support.
Practical Advice for the Financial Month:
Don't chase highs in the short term: The resistance level at 124545 is like a wall; before a breakthrough with volume, rushing up is likely to get you trapped.
The support level is a touchstone: Focus on 120095. If it repeatedly tests this level without breaking, you can lightly accumulate some 'pullback chips'; if it breaks with volume, temporarily reduce your position and wait for stabilization before proceeding.
Don't ignore the news: Although the technicals aren't crashing now, the crypto space is most afraid of 'black swans'. Keep an eye on the Federal Reserve's policies and the trends in the US stock market, just in case there is any sudden negative news that could break the support level in an instant.
Simply put, BTC right now is like a long-distance runner who is a bit tired but hasn't collapsed. The key is whether it can recover its strength at the 'supply station support level'. Short-term fluctuations are inevitable, don't over-leverage, set stop-loss, and follow the flow of funds without resisting too hard!
